Key Ratio
A stock’s key ratios provide valuable insights into various financial aspects of the company. They are derived from the financial statements and help investors evaluate the company’s financial health, performance, and overall investment potential.
Assessing Key Ratios may vary by the type of trader one is: Growth Investors differ from Swing Traders who differ from Position Traders. The platform offers different views using Key Ratios for such scenarios.
Key Ratios allow you to not only view the company’s financial health but also view them in relation to others in the same industry, comparing ‘apples to apples’. Having this information allows you to better evaluate potential opportunities.
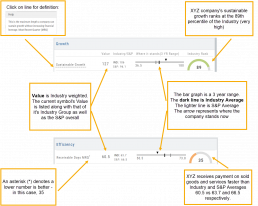
Deciphering the graphics
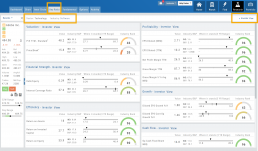
The illustrations show how to read the information provided as well as provide context on how the particular stock is performing to the Industry as well as the S&P.
Note: Depending on the Industry and/or S&P values, their tab(s) may not appear on the bar graph.
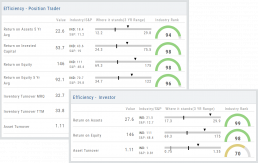
Select the view that matches your style of trading.
Just like trading, there is no ‘one-size-fits-all’. Those focusing on longer-term trades would not be interested in the same criteria as those who prefer shorter-term positions.
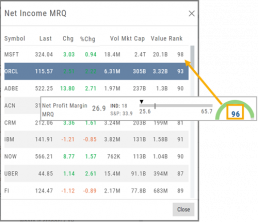
Clickable Key Ratio Value
View other industry stocks’ ranking by clicking on the numeric value as shown.
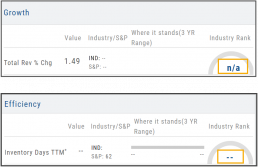
What does “N/A” or “–” indicate?
If a number does not appear in the Ratio criteria, you will see either a “N/A” or “—”
N/A indicates the datapoint is applicable, but the value not currently available
— indicates the data point does not apply, such as Inventory Ratios with Banks