Journal Tagging - OCO, Trailing Stops, etc.
OCO Journal Tagging
OCO Orders are automatically tagged in the Journal.
Once the Stock Order is Executed (it is an active Position), the Limit and Stop orders are Live (active Orders for the duration selected: Day or GTC.)
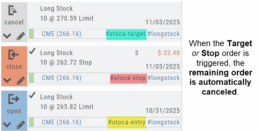
If/when the stock hits the Limit price, that order will execute, and the Stop order will be canceled. The Journal tab will be green and display a Gain/Profit.
-OR-
If/when the stock hits the Stop price, that order will execute and the Limit order will be canceled. The Journal tab will be red and display a Loss.
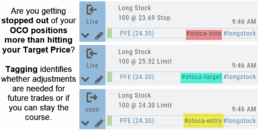
The tagged results show whether you’ve been hitting your target or getting stopped out.
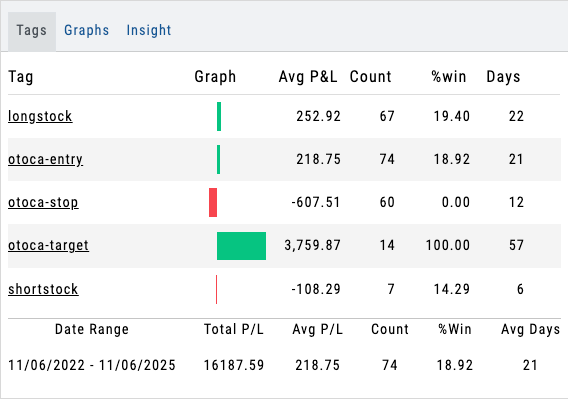
**Note: Past Conditional trades will be tagged as “otoca-entry”, “otoca-target” and “otoca-stop”.
Platform Features Release: Additional Features/Adjustments to Streamline Functionality
Announcing the latest Release of feature and functionality additions and enhancements to the trading platform to streamline/improve functionality.
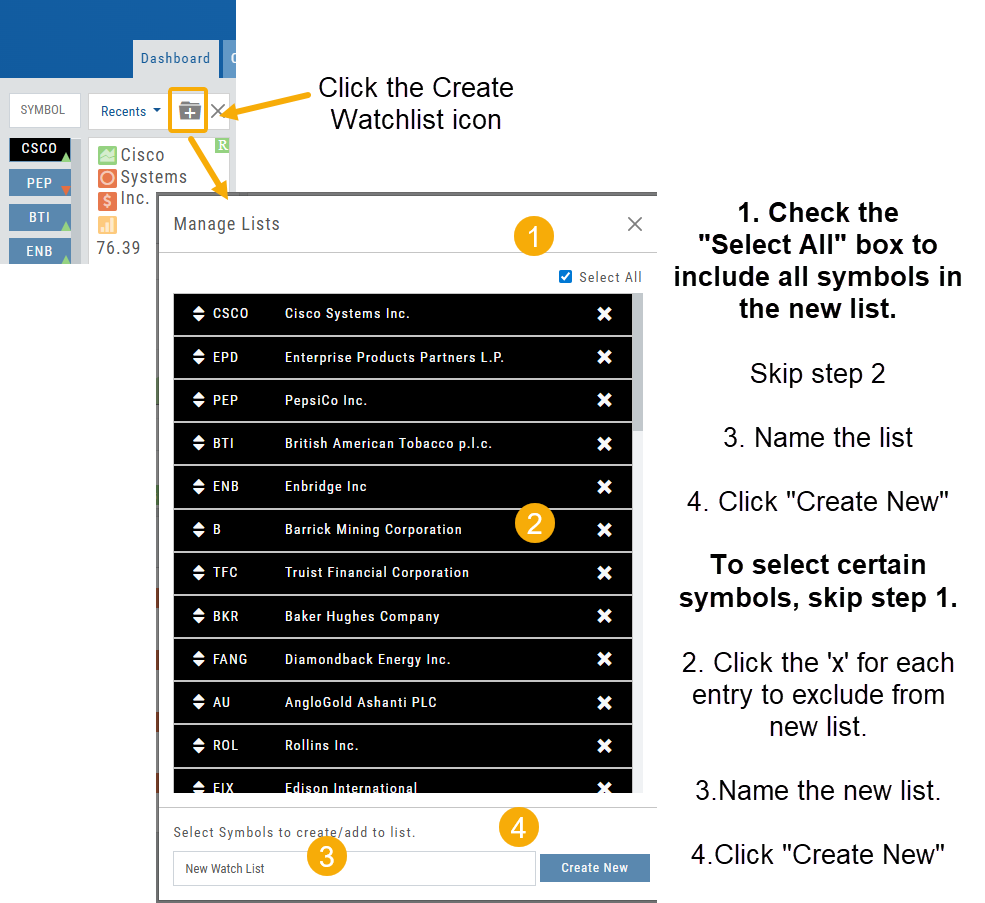
Build a Watch List from “Recent” List
Build a new Watchlist directly from the “Recent” list in Research.
Navigation Bar
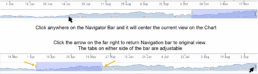
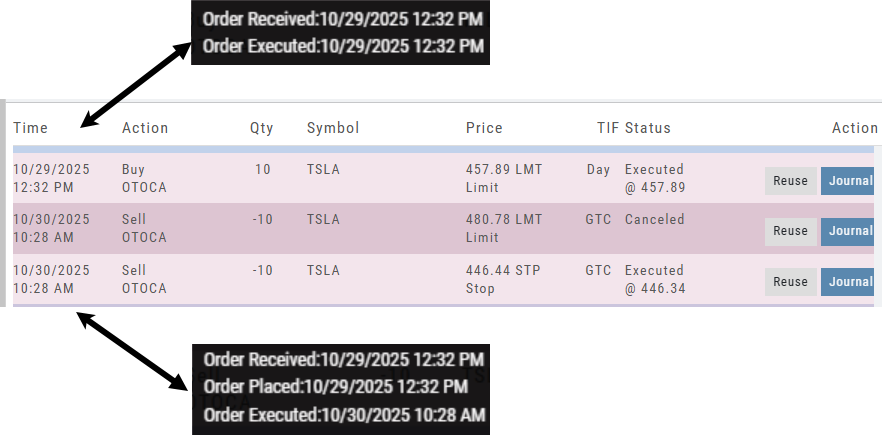
Order Status Time Stamp
Hover your cursor over the Order’s Date/Time info to display the Order’s activity Time Stamp.
Other Additions
- Enter a symbol, and it will appear in the symbol box. This works on any of the Research tabs.
- Adding a symbol when Creating a new Watchlist automatically adds to the list. The “Add” button has been removed.
Change Log
- Corrected “Close” action from Staged Trade
- Trailing % display corrected
- Renamed tooltip from “Add Watchlist” to “Create/Delete” vs. “Add/Delete”
Platform Features Release: Sandbox Trading Account, Order Status Filter & more
Announcing the latest Release of feature and functionality additions and enhancements to the trading platform to assist the investment/trading decision process.
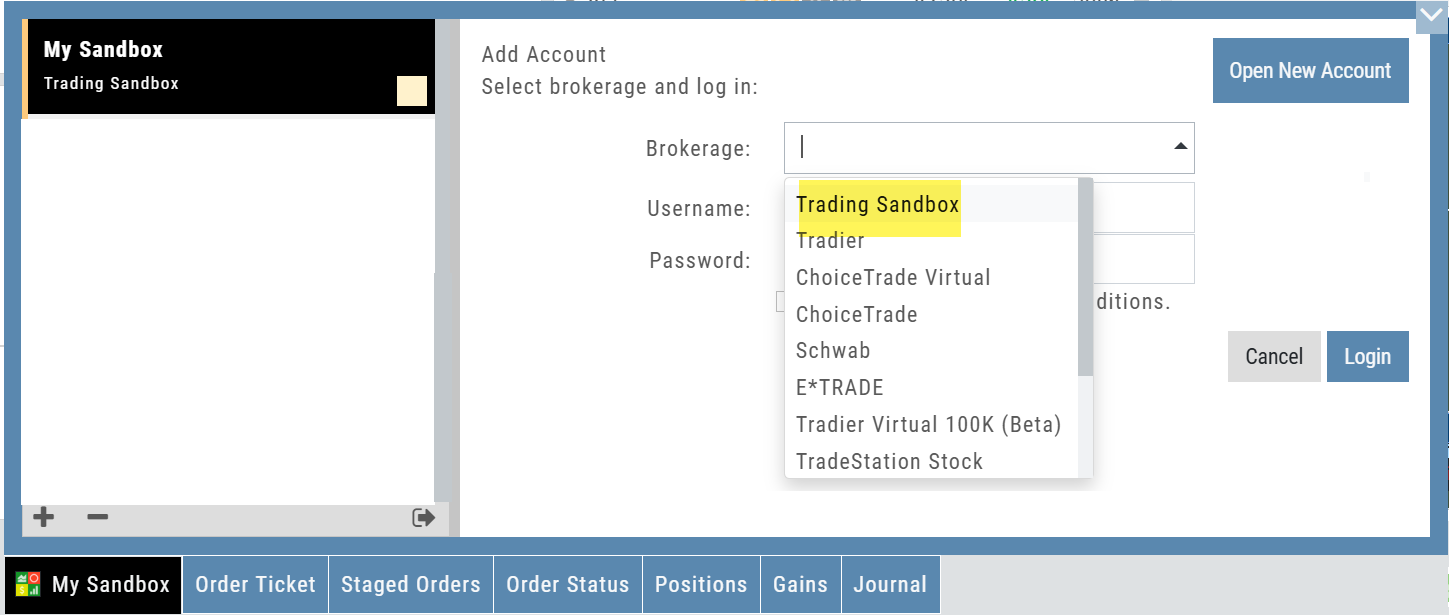
Trading Sandbox Virtual Account
Announcing a new Virtual Account with fast execution, accurate tracking, and reliability you can depend on.
Unlike traditional broker-provided virtual accounts, the Sandbox is not bound by brokerage margin rules or limitations, giving you more freedom to practice and test strategies.
The Sandbox uses delayed market data. In addition to fast, reliable trade execution and accurate trade capture, it also handles options correctly, supports Conditional Orders for stocks, full Journal Support, and more!
Order Status Filter Buttons
The Order Status Tab filter buttons make it easy to locate previous orders
![]()
- All – Everything in the time period is shown on the tab (Today, 1 Week, 1 Month, etc.).
- Open- Orders that have not yet executed as an active Trade/Position – includes Waiting Conditional orders.
- Working – Bracket orders where the underlying stock order is an active position (Stop/Limit orders). Excludes Waiting Conditional orders.
- Filled – Executed orders whether to open/modify/close
- Canceled – Includes both manually canceled as well as day orders that did not get filled prior to the end of the Market Day
OCO Journal Tagging
OCO Orders are automatically tagged in the Journal.
Once the Stock Order is Executed (it is an active Position), the Limit and Stop orders are Live (active Orders for the duration selected: Day or GTC.)
If/when the stock hits the Limit price, that order will execute, and the Stop order will be canceled. The Journal tab will be green and display a Gain/Profit.
-OR-
If/when the stock hits the Stop price, that order will execute and the Limit order will be canceled. The Journal tab will be red and display a Loss.
**Note: Past Conditional trades will be tagged as “otoca-entry”, “otoca-target” and “otoca-stop”.
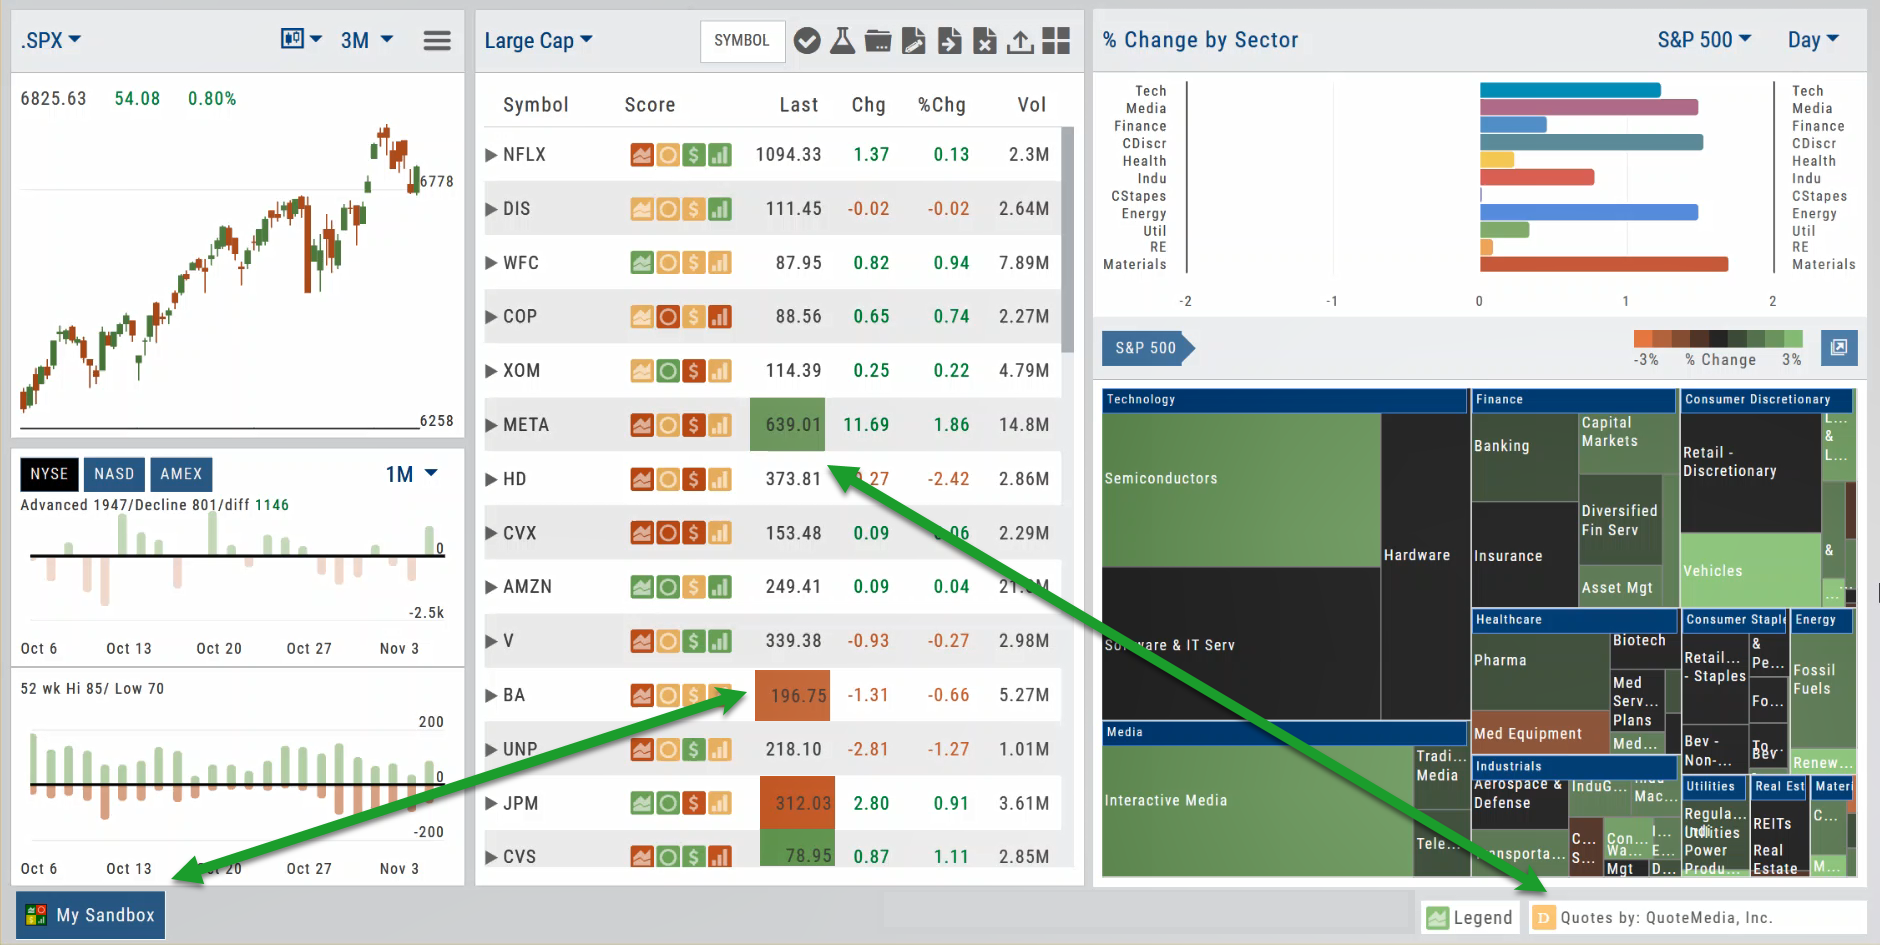
Delayed Streaming Quotes
Delayed Streaming Quotes will appear when you have a Virtual or Manual Account activated.
Click on the account tab so that it appears on the bottom left corner of your screen.
Extend Fibonacci Retracements on Charts
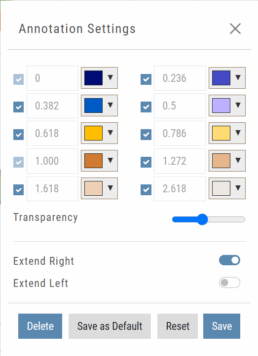
Fibonacci retracements can be extended right and/or left on the chart.
Click an existing Fibonacci annotation, then use the toggle switches to adjust it.
Don’t forget to “Save”
Note: Extend Right/Left can be edited/saved individually, not Set As Default.
Chart crosshairs
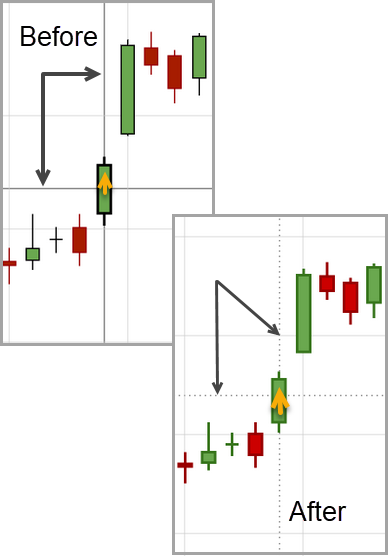
The cursor crosshairs on the chart have been adjusted so they no longer obscure the candlestick wicks
Other Additions
- Set “GTC” as default duration for Exit Order on Trade Ticket
- Modify TTM Squeeze formula to follow industry
- Auto-select Option Cycles for existing Order(s)
Change Log
- Resolved Screener glitch to move candidates to selected watch list
Key Ratio (formerly Valuation)
Key Ratio
A stock’s key ratios provide valuable insights into various financial aspects of the company. They are derived from the financial statements and help investors evaluate the company’s financial health, performance, and overall investment potential.
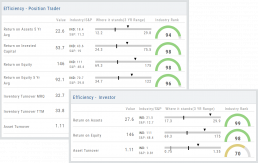
Assessing Key Ratios may vary by the type of trader one is: Growth Investors differ from Swing Traders who differ from Position Traders. The platform offers different views using Key Ratios for such scenarios.
Key Ratios allow you to not only view the company’s financial health but also view them in relation to others in the same industry, comparing ‘apples to apples’. Having this information allows you to better evaluate potential opportunities.
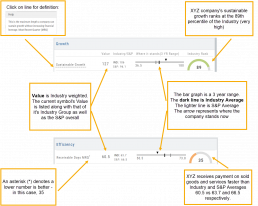
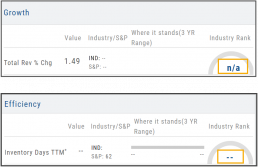
Deciphering the graphics
The illustrations show how to read the information provided as well as provide context on how the particular stock is performing to the Industry as well as the S&P.
Note: Depending on the Industry and/or S&P values, their tab(s) may not appear on the bar graph.
Select the view that matches your style of trading.
Just like trading, there is no ‘one-size-fits-all’. Those focusing on longer-term trades would not be interested in the same criteria as those who prefer shorter-term positions.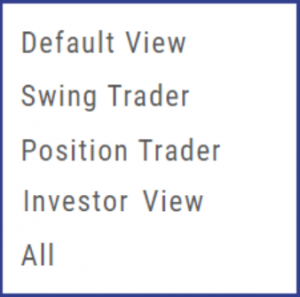
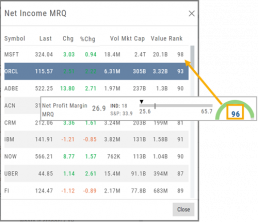
Clickable Key Ratio Value
View other industry stocks’ ranking by clicking on the numeric value as shown.
What does “N/A” or “–” indicate?
If a number does not appear in the Ratio criteria, you will see either a “N/A” or “—“
N/A indicates the datapoint is applicable, but the value not currently available
— indicates the data point does not apply, such as Inventory Ratios with Banks
Fundamentals Tab
Fundamentals
Fundamentals provide valuable insights into the financial health and performance of a company. They offer a comprehensive analysis of the company’s operations, profitability, growth potential, and overall stability.
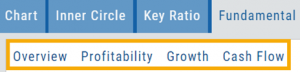
Fundamentals are comprised of Earnings, Dividends, Price Projections, Profitability, Growth, and Cash Flow.
Profitability, Growth, and Cash Flow offer even more detail. Either click the button in that section:
![]()
OR click the appropriate category at the top of the window:
Earnings data provide insight into a company’s financial health and performance.
Past earnings reports offer insight into the company’s historical growth, profitability, and stability. Positive earnings trends may indicate a well-performing company. Negative or declining earnings could be cause for concern.
Earnings
Earnings projections provide forecasts of a company’s future earnings to gauge Market sentiment and investor expectations. Projections are compiled by financial analysts using factors such as industry trends, company guidance, and economic conditions. Surpassing or falling short of projections can greatly impact stock price.
Some benefits to both the company and shareholders include:
Income Generation
Shareholder Loyalty
Return on Investment
Dividend Reinvestment
Signal of Financial Health
Possible Tax Advantages
Disciplined Capital Allocation
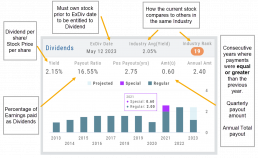
Dividends
The decision to pay dividends is up to the company’s management and board of directors, who weigh various factors, including the company’s financial position, growth prospects, and other capital allocation priorities. Dividend payouts are not guaranteed and may fluctuate or be suspended based on the company’s circumstances and strategic considerations.
Price Projection
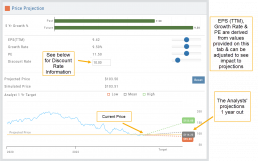
Discount Rate
Determining the appropriate discount rate for a stock is a subjective process and depends on various factors.
Here is an example:
- Risk-Free Rate: Start by considering the risk-free rate, (the theoretical rate of return on a risk-free investment such as government bonds). This serves as a baseline for the discount rate. An online search can locate this information for you.
- Risk Premium: Assess the risk associated with the specific stock you are evaluating. Stocks are inherently riskier than risk-free investments, so you need to add a risk premium to the risk-free rate. The risk premium accounts for the additional return expected by investors for taking on the extra risk. The risk premium can vary depending on factors such as industry, company-specific risks, economic conditions, and market volatility.
- Beta: This measures its sensitivity to market movements.
Beta of 1 = the stock moves in line with the overall market
Beta > 1 = the stock has higher volatility and would warrant a higher discount rate to reflect the increased risk. - Company-Specific Factors: Are there unique company factors (financial health, competitive position, growth prospects, management quality, etc) that could positively or negatively influence the discount rate?
- Sensitivity Analysis: Changing the discount allows you to assess the impact of the stock’s valuation. Some sectors are subject to more volatility than others: the Energy and Material Sectors tend to be more volatile than Consumer Staples or Utility Sectors.
The discount rate is subjective. Different investors might have different views on what the appropriate discount rate is for a given stock, based on their own risk tolerance, the specific risks associated with the company, and their expectations for future market conditions.
Profitability
Revenue: Money generated from sales of goods or services. It is income earned prior to deducting expenses or costs
Cost of Revenue: Expenses directly related to production, manufacturing, or acquisition of products/services sold. Typical examples include raw materials, labor, overhead, etc.
Operating Expenses: Day-to-day, necessary operating expenses not directly related to the production/acquisition of goods/services. Examples: Wages, utilities, depreciation, advertising, etc.
Other Expenses: Depending on the nature of the business can include: Taxes, Interest, Non-operating losses, Restructuring, Non-recurring, etc.
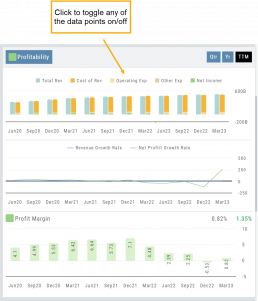
Revenue Growth Rate: Percentage change (+/-) in a company’s sales/revenue over a period of time:
Revenue Current–Revenue Previous/Revenue Previous x 100
Net Profit Growth Rate: Percentage change (+/-) in a company’s net profit over a specific period of time:
Net Profit Current–Net Profit Previous/Net Profit Previous x 100
Profit Margin: Percentage of revenue a company retains after deducting all expenses.
A higher profit margin indicates a company is generating more profit relative to its revenue. A lower percentage suggests higher expenses in proportion to revenue.
Growth
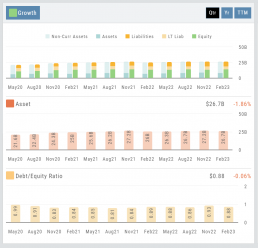
Asset: These can vary by industry/company. Common examples that contribute to a company’s growth are Financial, Intellectual Property, Human Capital, Physical Assets, Technology/Info Systems, Customer Base, Brand Equity, Partnerships, and Networks.
Debt/Equity Ratio: Total Debt divided by Total Equity. Interpretation varies by industry and a company’s specific circumstances: a high ratio can indicate higher financial risk OR effective management of debt through cash flow. A low ratio can indicate a conservative financial position OR under-utilization of debt and missed opportunities for growth.
Non-Current Assets: Resources not intended to be converted into cash or used up within a year.
Assets: Anything of value that has the potential to generate future economic benefits.
Liabilities: Obligation or debt a company owes to external parties that must be fulfilled in the near future.
Long-term Liabilities: Obligation or debt a company owes but has more than a year to repay.
Equity: The portion of a company’s value belonging to its owners or shareholders after all debts and obligations have been settled
Operating Cash Flow: Represents the cash inflow/outflow directly related to day-to-day activities including sales of goods and services, paying operating expenses, and collection of receivables.
Free Cash Flow: Cash flow available for discretionary use after accounting for operating expenses, capital expenditures, and changes in working capital. Positive values offer opportunities, negative values may indicate financial challenges.
Cash Flow
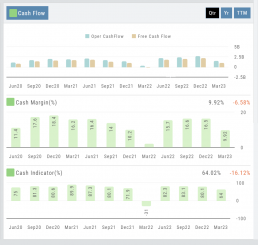
Cash Margin %: Percentage of cash generated from a company’s sales revenue after deducting its cash operating expenses. It measures the profitability and efficiency of a company’s operations to generate cash.
Cash Indicator: The industry percentile ranking of a company’s ability to generate cash from its operations.
Position Notifications
When you Enable and Activate Account Notifications, you’ll receive emails on upcoming activity that may affect your existing positions.
- Upcoming Earnings – Monday Morning via Email
- Upcoming Dividends – Monday Morning via Email
- Option Position Expiring – Two days prior via Email
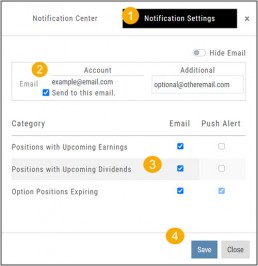
To begin, locate and click on the Envelope Icon at the top of the platform page, next to your Username:
![]()
Follow the steps as outlined and illustrated:
- Click on Notification Settings
- Add your email (Optional: Add 2nd email)
- Check/uncheck Categories
- Click “Save”
The settings can be updated at anytime by following the above steps.
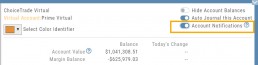
Next:
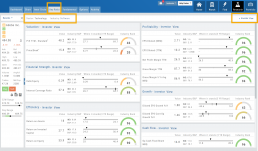
For each account you want to receive notifications on, toggle the switch located on the Account Summary tab to the “On” position as shown in the graphic.
**Without this step, you won’t receive the notifications.**
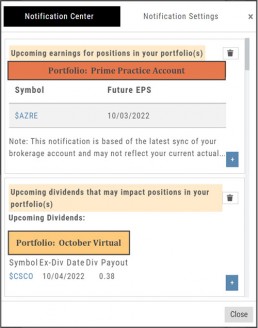
Expiration Notifications will be emailed 2 days in advance.
Each Monday, prior to Market Open, an email will be sent where there’s an Earnings or Dividend for any of the positions in the account(s) you have activated.
The Notification Center will list what has been emailed to you for each account you have activated.
The Account Name and associated Color Tag will be displayed on each Notification and allows for quick identification.
Platform Features Release: October 2022
Announcing the latest Release of feature and functionality enhancements to the trading platform. These features and enhancements help keep users informed with activity on their trades. Functionality has been added to review a Watchlist in the Research tab, while being able to see at a glance which symbols have a price increase or decrease.
Notifications – Receive emails on upcoming Earnings, Dividends or Expiring Positions
Watchlist Research Functionality – Access and view your Watch Lists in the Research Tab via a drop-down box
Price Action Arrows on Symbols in Research Tab – Instantly see latest price action while on the Research Tab
Trade Position Notifications – Premium Feature
Want to receive weekly emails of Expiring Positions, Upcoming Earnings and/or Dividends on existing trades you have in your accounts?
This Premium Feature allows you to do just that in a 2-part process:
First: Click on the the Envelope Icon at the top of the platform screen:
![]()
Go to “Notification Settings.”
Provide your email address(es).
Select Notifications you want to receive.
Click “Save”.
Next: On your Portfolio Accounts, go to the Account Summary Page and Toggle the switch to the On position.
Repeat this process for each Account you want emailed Notifications.
Expiration Notifications will be emailed 2 days in advance.
Each Monday, prior to Market Open, an email will be sent where there’s an Earnings or Dividend for any of the positions in the account(s) you have activated.
The Notification Center will list what has been emailed to you for each account you have activated.
The Account Name and associated Color Tag will be displayed on each Notification and allows for quick identification.
Each Monday, prior to Market Open, an email will be sent where there’s Earnings or Dividend for any of the positions in the account(s) you have activated.
The Notification Center will list what has been emailed to you for each account you have activated.
The Account Name and associated Color Tag will be displayed on each Notification and allows for quick identification.
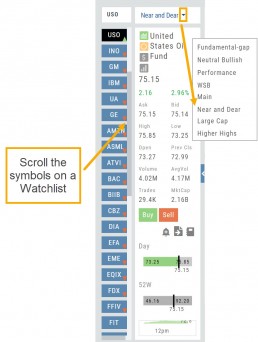
Research Watchlist Functionality
Users are able to access all Watchlists from the Research Tab.
Click the ![]() to access the dropdown list as shown in the graphic.
to access the dropdown list as shown in the graphic.
Lists with more than 20 symbols will have a scroll bar allowing for easier research of larger lists.
All other functionality remains the same: Symbols can be moved to other lists, have alerts set, deleted, add Journal notes
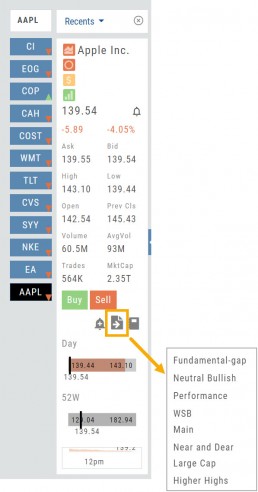
When a symbol is entered in the Symbol Search Box on the Research Tab, the symbol will automatically be displayed on the default “Recents” list.
In addition, when a symbol or group of symbols is sent to Research from anywhere else on the platform, it will appear on a list under the default “Recents” list.
Examples of when the “Recents” list will be displayed:
- Sending a symbol/symbols from a list on a Watch Tab.
- Selecting a group of symbols from a Scan or Screener list.
- Clicking on the Technical Icon from any symbol when not in the Research Tab. will be displayed under “Recents”.
The functionality of adding a note, an alert or sending a symbol to a specific list remains the same.
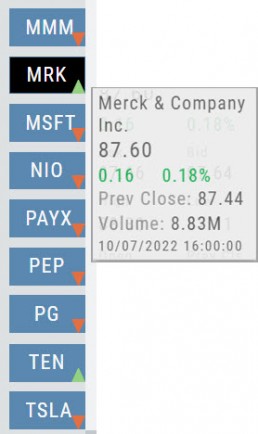
Green and Red Arrows have been added to each symbol tab when in Research.
This applies to any selected Watchlist or the default “Recents” list.
Each time one symbol is clicked, the entire list will update the latest price update.
Change Log
- Upper Indicator responsiveness corrected
- Profitability info loads correctly on Fundamental Tab
- Completed Bear Put description on Strategy Template
- Corrected display data on Fundamental Tab
Platform Features Release: New Option Chain Functionality/Appearance, Responsive P/L Graph
Features Release Notes:
New Option Chain Functionality/Appearance, Responsive P/L Graph
Announcing the latest features/functions updates, additions or edits to the trading platform:
Option Chain Functionality/Display has been revamped to allow users to control which information to view and increase responsiveness. Symbols, such as SPY and SPX, will load noticeably faster. An incorporated Dashboard provides a snapshot of current activity allowing users to make more informed decisions.
Responsive P/L Graph adjusts when the slide bar between Bid and Mid price is adjusted. This is especially helpful when the spread is considerable.
Option Chain Display/Functionality
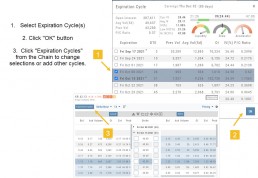
Select Expiration Cycles
The redesigned Option Chain allows users control of what Expirations to view instead of the platform defaulting to a cycle approximately 30 days out.
Click on the Options Tab from Research.
A window with available Expirations will appear along with a Dashboard with pertinent information (Volume, IV, OI, Earnings Date, etc) for more informed decision-making.
As a bonus, this structure allows data to load faster – especially helpful for those symbols with large option chains.
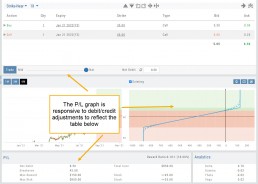
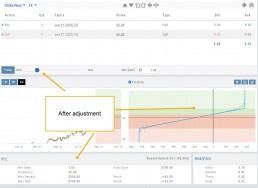
Responsive P/L Graph
The P/L graph on the Options Tab is responsive to adjustments made to the trade set up for the entry Net Debit/Net Credit.
Note, the smaller the spread between the Bid/Ask, the smaller the graph adjustment will be.
The example illustrates a large spread to better illustrate this feature update.
Change Log
- Price representation on chart X/Y axis corrected
- Journal Notes enhancement
- Saved screeners adjustment
- Active Watchlist access corrected
- Close from Backtest saves Symbol
- Clarified wording on Warning Message
- Mobile version of Saved and System Screener
- Mobile app – rolling trade adjustments
- P/L ‘Go Big’ data correction
- Account Summary page enhancement
- Large number displays on HeatMap
Platform Features Release: Smart Trade Ticket, Global Chart Settings, Updated Fundamental Tab, Order/Trade Chart Display
Features Release Notes:
Smart Trade Ticket, Global Chart Settings, Updated Fundamental Tab, Order/Trade Chart Display
Announcing the latest features/functions updates, additions or edits to the trading platform:
The Smart Trade Ticket is easier to use and allows for future capability depending on what brokerages offer. One Example if this would be Conditional Orders.
Global Chart Settings have always housed where to control candlestick/volume bar colors as well as Tooltip displays. Now, clicking on the gear allows you the ability to display Annotations, Positions/Orders and Events.
The Fundamental Tab under Research has an improved, easier to read display with additional features for a clearer snapshot of a stock’s past and forecasted performance.
You’ll be able to differentiate a Conditional Order from a Staged Order as well as a Yet-To-Be-Executed-Order with the enhanced Order/Trade Display.
Smart Trade Ticket
Smart Trade Ticket
The redesigned Trade Ticket has defined sections for Stock/ETF trades and Option Trades. The Stock Ticket is divided into Open and Exit sections for easier use.
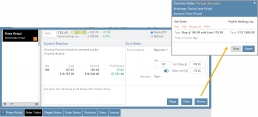
The Close Ticket provides a summary of any Profit/Loss on the trade. Brokerages determine available Order Types, which may include the following to open a trade:
Note: Closing Order Types may also include Trailing $ and Trailing %.
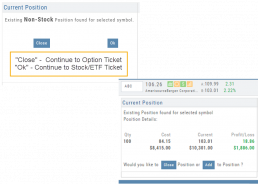
If there is an existing position on a Symbol when a new order is created, the Smart Ticket system will identify if there is an existing Non-Stock/Multi-leg Position or an existing Stock position.
If Non-Stock/Multi-leg position, clicking “Close” will navigate the user to the Option Trade Ticket. Clicking “Ok” will lead the user to the Stock/ETF Ticket.
If there is an existing Stock position, a summary of the existing will display along with the ability to Close or Add to the existing position.
Global Chart Settings
Global Chart Settings
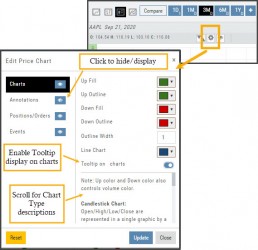
Manage common chart settings from one location by clicking on the left-most Gear icon on the Chart Header which is located under the saved chart periodicities.
In addition to setting your Bullish/Bearish candlestick and corresponding Volume bar colors and control of whether you want Tooltips to display on the chart, you can view/hide:
All Chart Settings
Annotations
Orders/Positions
Events (Dividends/Earnings)
Simply click the ‘eye’ icon to display/hide your selection. Once finished with your Global Settings, click “Update,” then “Close.” To reset to default settings, click “Reset.”
Improved Fundamental Display
Fundamental Data has a new look
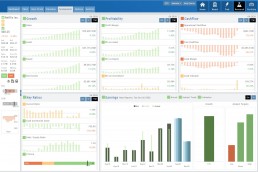
The area charts under the Research>Fundamental tab have been replaced with bar charts for easier understanding.
A Tooltip appears when you hover your cursor over the bar charts providing information for that data point.
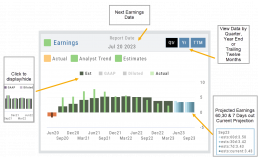
Estimated Earnings is now in the same window as Historic Earnings for clearer comparison as both sets of data now have the same orientation
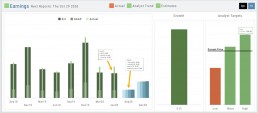
The Earnings display has been enhanced to illustrate past and projected data in the same window to match the orientation for a more accurate ‘apples to apples’ comparison.
Click on any of the legend icons to toggle the data displayed.
![]()
The Analysts’ Target Window displays the current stock price as a horizontal line for reference.
Custom Page Enhancements
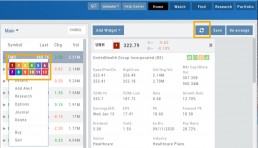
The widgets with that number will automatically populate accordingly.
To change displaying one symbol to another using a Watchlist, simply click on the Action Icon of new Symbol and select the number of the current Symbol you want to replace.
A refresh icon ![]() has been added to the Header to make it easy to update the Custom Page display after rearranging widgets.
has been added to the Header to make it easy to update the Custom Page display after rearranging widgets.
We’ve increased the number of symbols that can be tagged from 6 to 12.
Using the Watchlist displayed on the left side of the screen, click the Action Icon (triangle) to left of Stock Symbol you want to display and assign a number, 1 to 12.
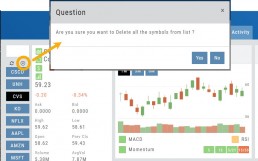
Delete Notice added to Research Tab
A Warning Notice now displays when ‘x’ is clicked on the Research Tab requiring confirmation prior to removing the list of symbols from the tab.
Change Log
- Heat Map filter setting/saving improved
- Interval call split adjustments
- Greek Summary displays on Positions tab
- ETF list on Home Page issue resolved
- Strike Arrow functionality restored on Option Chain
- Sorting Scan after scrolling behavior corrected
- Eliminated stacking Indicators on charts
- Alert list is scrollable
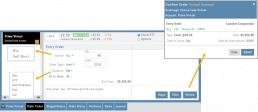
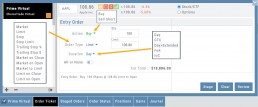
The Order Ticket - Stock/ETF
The Order Ticket is designed for ease of use and flexibility.
Selecting “Stock/ETF” or “Options” will display the appropriate ticket.
Brokerages determine what Order Types and Duration selections are available.
All or None allows you to dictate whether to accept partial fill of an order or not. Toggle to turn this on/off.
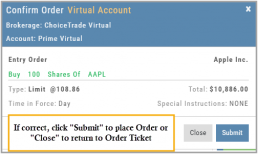
The Order Summary appears below Order details as an additional security step to ensure your order is correct.
Click “Stage” for later review, “Review” to continue the Order process or “Clear” to start over.
Note: If you start an Order in one account, then switch accounts, you’ll review the following notice: 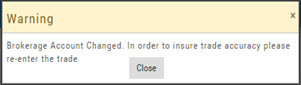
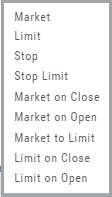
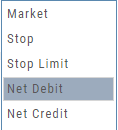
Order Types are in a drop-down box and the types offered often vary from one brokerage to the next.
‘Duration’ – How long the order is good for: Day (current trading day) or GTC (Good til Cancelled) 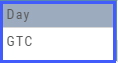
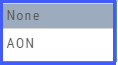
‘Condition’ – Must be met for the order to be filled/executed: “None” (no conditions) or “All or None” (all of the order must be filled, or none at all).
 After completing the order ticket, click ‘review’, then ‘submit’.