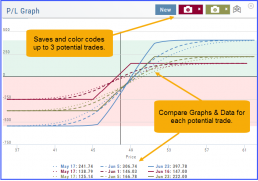
Any position entered in the Options Chain (Calls+Puts, Calls or Puts) will automatically display a profit/loss risk graph. The P/L Graph shows the Trade Profile Performance from the current day.
You can compare up to three (3) positions on one graph by utilizing the Camera Icons. Once you complete one trade scenario, click the first camera then click ‘New’. Structure your second trade scenario, click on the second camera. To add a third scenario, click new to structure an additional trade. The graphs will overlay.

