Announcing the latest Release which added a powerful Lower Indicator on the Charts Tab: 52 Week Hi/Lo. Price/Date info has been added to X/Y axis
52-Week Hi/Low Indicator
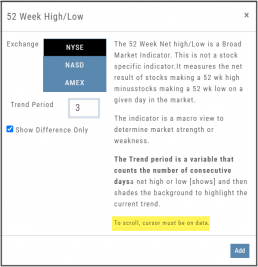
The newest lower indicator: 52-week Hi/Low Indicator is a Broad Market Indicator. It is not Stock specific.
View how individual Stocks/ETFs are faring compared to the Broad Market.
Select from NYSE, NASD or AmEx
There are two views:
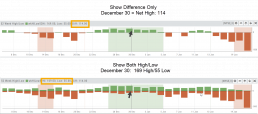
Show Difference Only – Display either a green or red (or no) bar representing the net advancers/decliners for that period.
Show High & Low (uncheck box)– Displays both green/red bars to illustrate number with new 52 week high/lows.
The background color identifies a bullish or bearish trend, based upon the number of days selected (Trend Period)
Example: If 3 days are selected, background highlight will begin on the 4th consecutive day of gains (or losses).


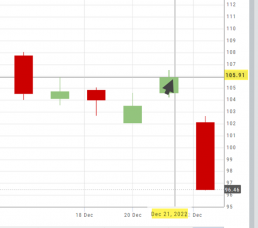
X/Y axis – Price/Date display

The cursor’s crosshairs will display the Price/Date info along the X/Y axis for easier reading.
This information will still appear in the upper/right corner above the chart:

Drawing Key Activation
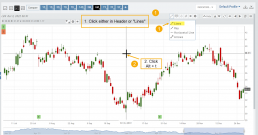
Use your keypad to activate drawing lines on the Chart by following these steps:
1. Click either in Header area above the chart – OR –
Click the Annotation icon>Line
2. Click on chart, then “Alt” and “T” keys where you want to start line.
Once activated from either of the starting points (1), the function works on the current chart, without having to reactivate by clicking on the Header or Annotation icon.

