Features Release Notes:
New Scans, Journal Summary, Analytical Graphs, Earnings Sort feature on select Scans
We’re pleased to announce the new version of the Trade Tool Trading Platform. Previous Releases provided the framework for new features and enhancements made available on this Release.
Cutting-edge technology enables the platform to Adapt and Respond to available space on Desktop and Tablet devices upon which the platform is viewed.
Platform utilizes Adaptive Technology
The platform now utilizes “adaptive” and “responsive” technology. This means the platform will take advantage of the screen size made available to it.
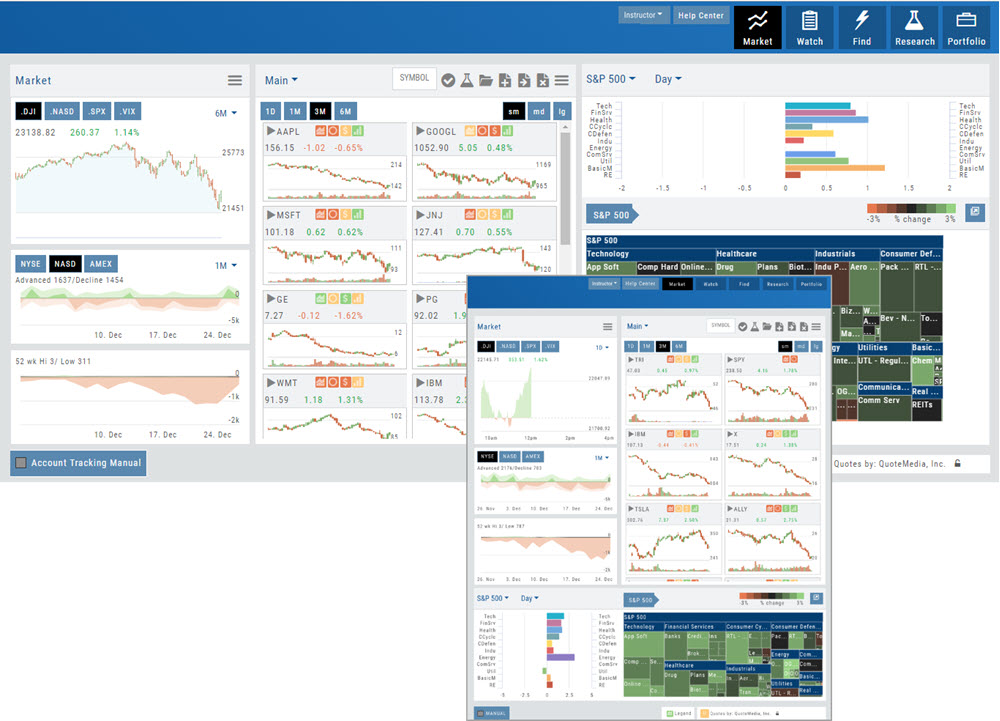
If you have a larger screen, it will stretch the content to fill. The result will be longer, viewable watch lists, options chains, and vertically filling content.
Tablets will stack content which creates a much better experience in Portrait View.
Enhanced Reconciliation in Journal
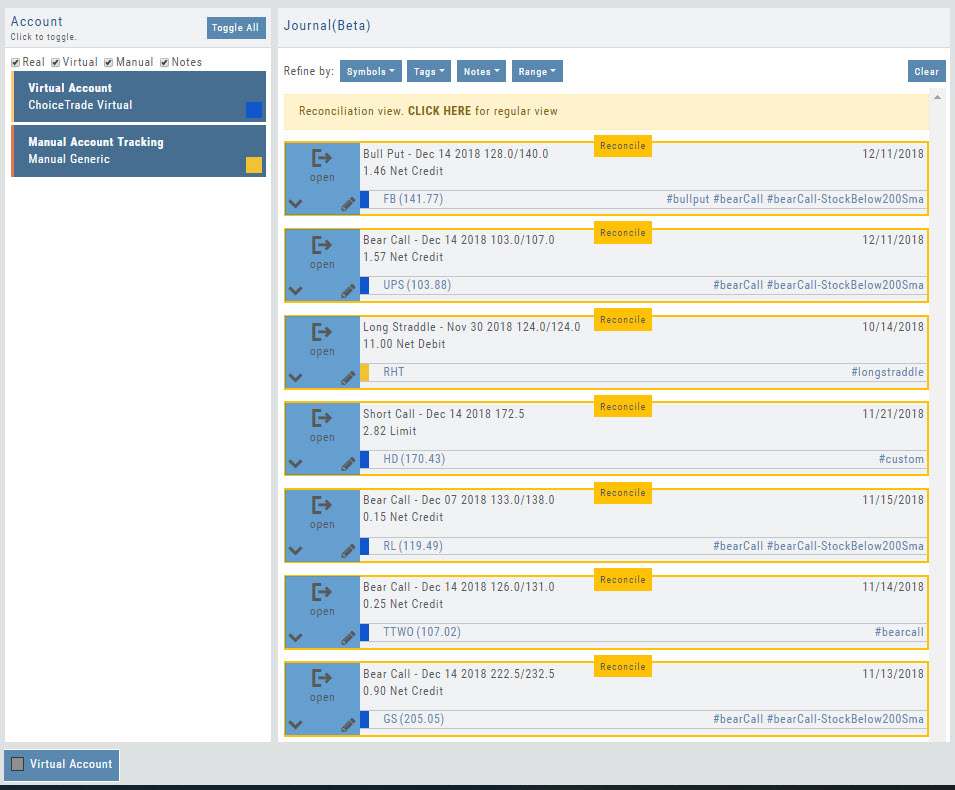
Reconciling trades is important and necessary for the Journal to accurately display Analytics including Win/Loss ratio. Analysis can be done by Symbol, Account, Tags, Date Range by using the ‘Refine By’ button selections.
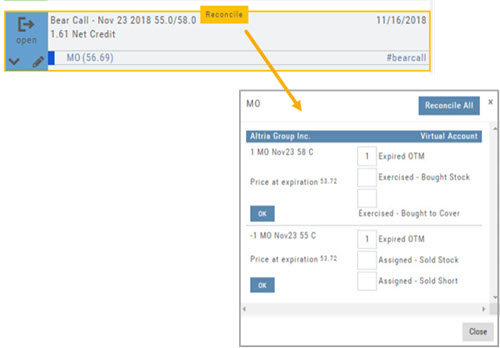
Now it’s easier to review such trades. The following notice appears, giving you the ability to view all trades in the selected account(s) needing reconciliation.

Clicking “Reconcile” on the individual trade tab allows you to confirm the outcome of the trade:
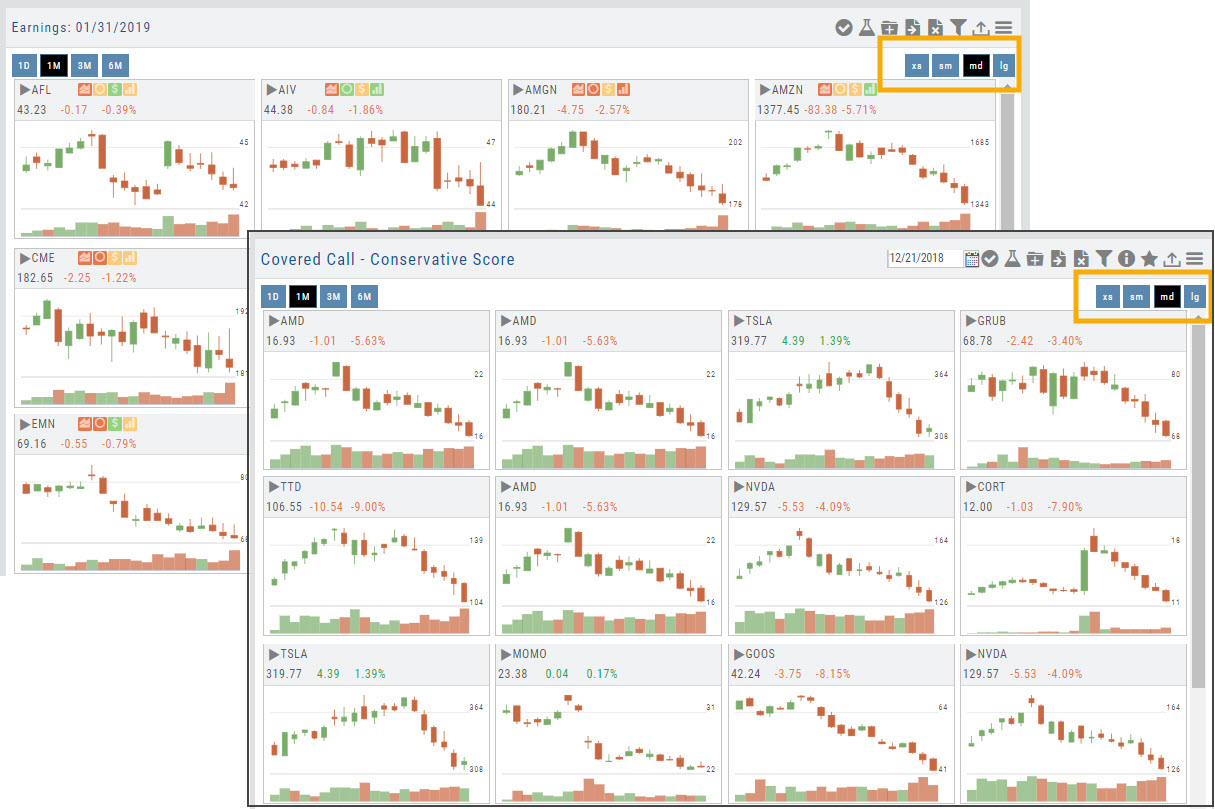
Tile View Size selection available throughout Platform
Tile View offers size options throughout the platform. Size and Periodicity buttons are ‘locked’ at the top of the lists for continued access. The platform’s new Adaptive and Responsive technology adjusts the number of tiles per row based on available space
Select “Small”, “Medium” or “Large” on Market and Watch Tabs
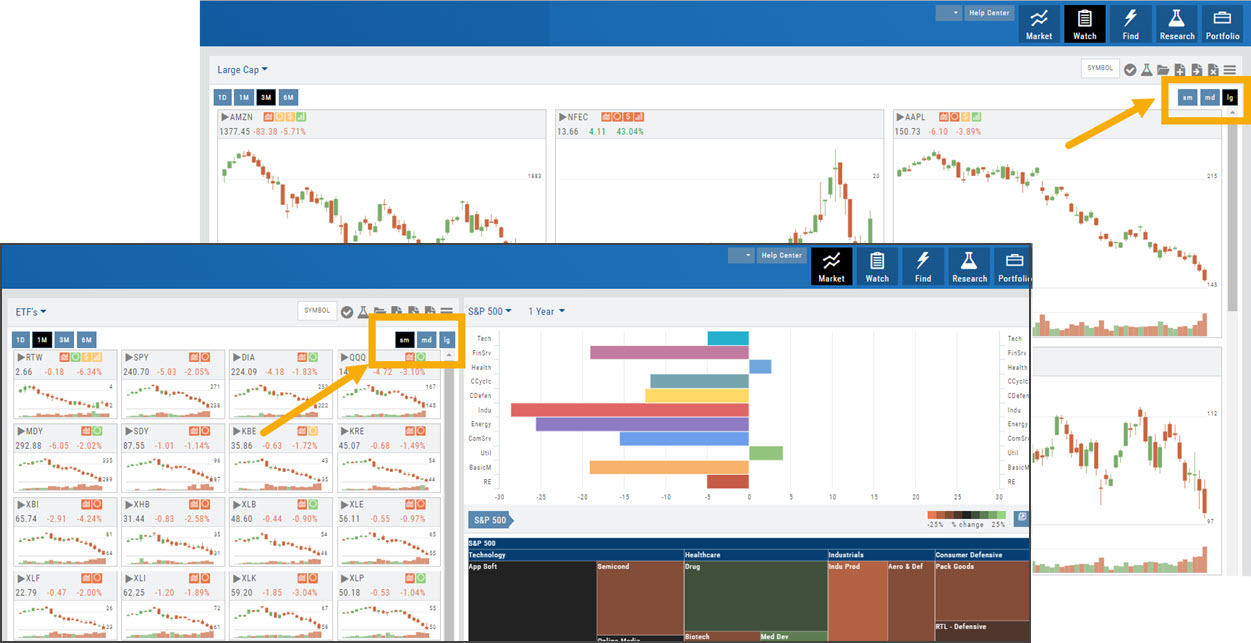
Scans and Earnings/Dividends Calendar offer 4 sizes: Extra Small to Large.
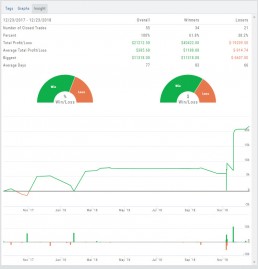
New “Insight” Tab in Journal
The new Insight Tab in the Journal offers visual feedback on your trading activity. The graphs are responsive to and update automatically based upon criteria selected including:
- Trading Account
- Symbol(s)
- Tags
- and/or Date Range
The top graph shows the overall activity, as well as Winners & Losers.
The middle line graph displays profitability or losses over the date range selected.
The bottom bar graph shows profit/loss by trade in the selected date range.
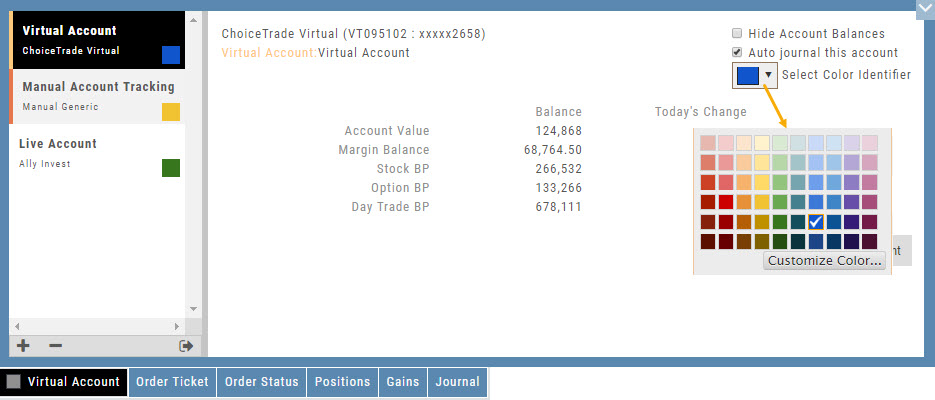
Color Coding Accounts
Each trading account can be assigned a unique color from the Account Summary Tab. Each Trade or Order entry within this account will display this color tab in the Journal for easy account identification.
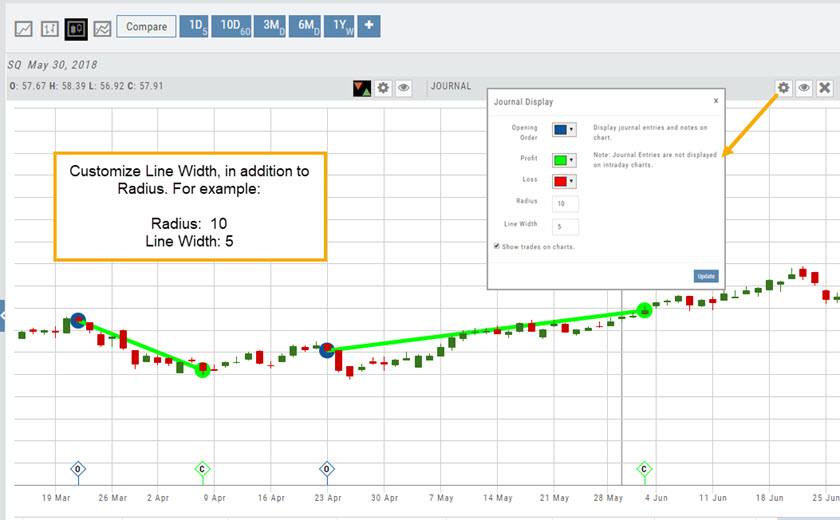
Journal Activity Line
The Journal Activity Line is customizable. Once this indicator is added to your Chart Profile, simply click the Gear icon ![]() to adjust settings:
to adjust settings:
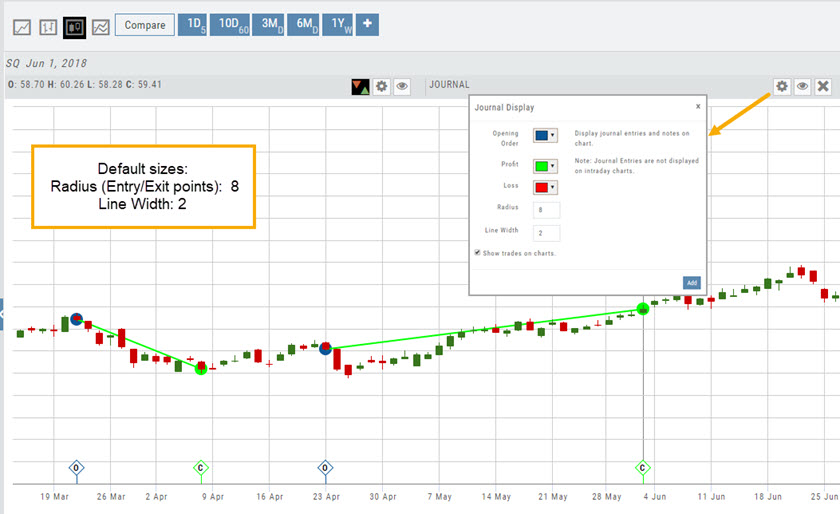
Enter ‘Line Width‘ as well as other adjustments you wish to make on this Indicator , including Open/Close color/size and Profit/Loss line colors.
When completed, click “Add” to close the Journal Display Box and update display.
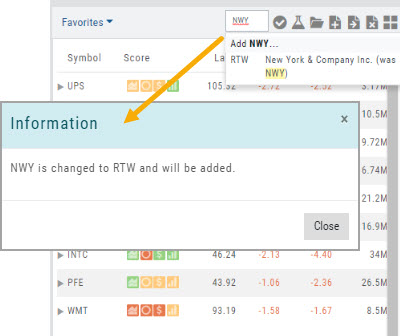
New Symbol Verification
Symbols will automatically update if an invalid symbol is entered and a new symbol exists.
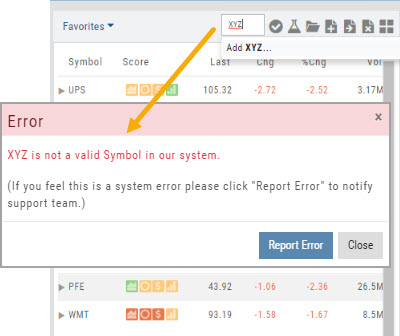
If a symbol is not recognized, an Error notice will popup notifying the user of this. By clicking “Report Error“, the system will automatically research, and, if valid – add the symbol to the platform.
This process helps eliminate incorrect symbols from being added to the platform.
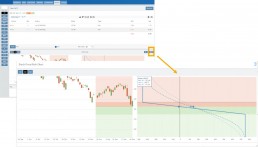
“Go Big” Button added to Strategy Template
Trade Detail of a Trade Finder Scan now includes a “Go Big” option button on the P/L graph.
This allows for not only easier viewing on smaller display screens, but also displays Stock Price/Risk Chart with three price points:
Current day (dotted line)
Halfway point to Expiration (dashes)
Expiration Day (solid line)
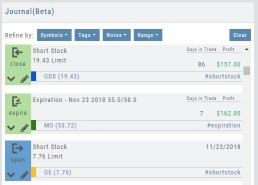
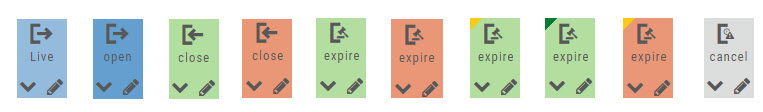
Simplified Journal Tabs
Tabs now display action of the Order/Trade for simplified at-a-glance status. Click below for detailed information on color codes of these tabs.
Enhanced Dashboard Overview
The Dashboard Tab, under Research, has a ‘cleaner’ look: Larger tables, easier-to-read data are among the enhancements made possible by the Adaptive/Responsive Technology.
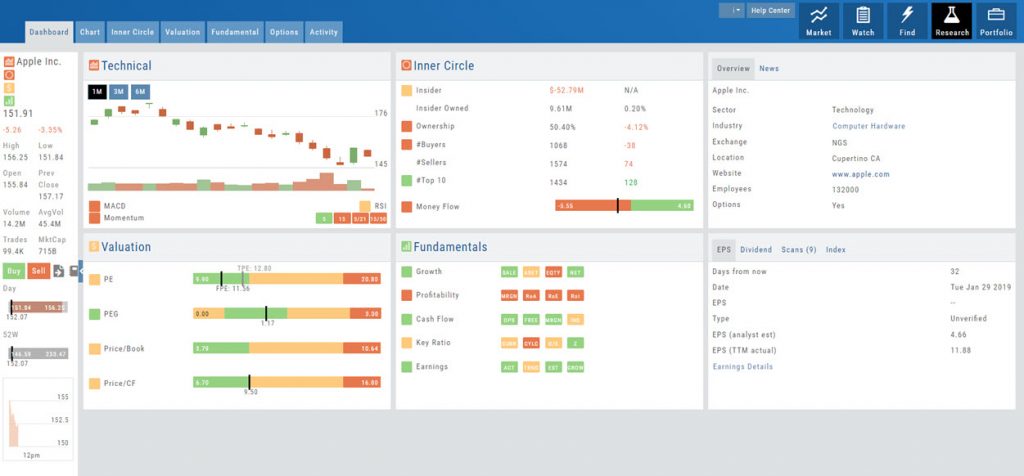
The Overview Table, located at the upper right of the Dashboard, provides additional information, simply by clicking on the following:
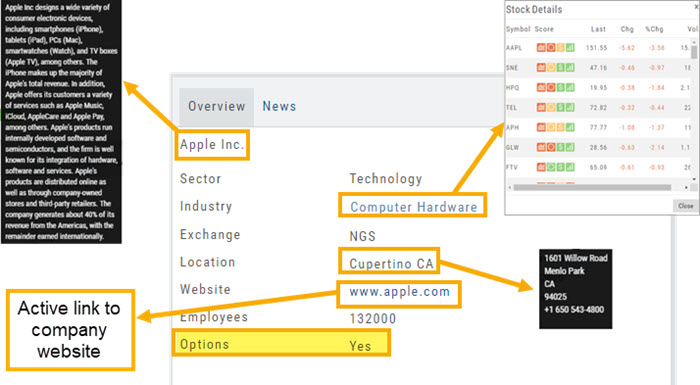
- Name: Company Overview
- Industry: Competitors
- Location: HQ address
- Website: Live link to Company website
Finally, this table shows whether or not the stock is Optionable.
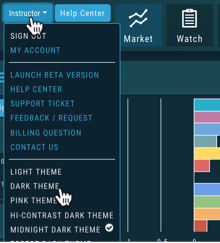
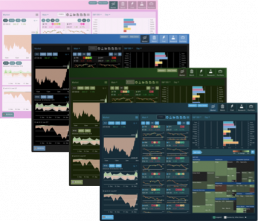
New Themes Available
More theme choices are available, not just “Light” or “Dark”. Simply click on your Username at the top of the platform sen and select from High-Contrast Dark, Midnight Dark, Forest Dark or even Pink.
Additional Journal Enhancements
- Automatic 2-month trade/order status update when logging into account
- Notes can be tagged to Brokerage Account
- Substantially improved Trade Match upon Closing, Legging Out or Adjusting
- Refined rules on Notes filtering
- Improved Reconciliation & Price data
Other New Chart Features
- Tooltip displays TradeFinder name (Ex: BullCall)
- Simplified Chart Header: Improved placement & display
Other Added Features
- “Legend” expands to display individual Score Icons at bottom of platform screen
- Increased Options Chain loading speed
Change Log:
- Covered Call correctly represented on charts
- Newly added brokerage account is default account
- Time zone issue corrected for Journal entries on charts