Platform Features Release: Additional Alert Functionality, Watch List Alerts, Info Button, Trade from Charts
Features Release Notes:
Additional Alert Capability, Set Watchlist Alerts, Alert Management Info Button, New Trade Button on Charts
Announcing: Expanded Alert Capabilities, Watchlist Alerts Information Button, Trade Function from Charts
We’ve increased Alert capabilities to give users more ability to identify trade entry, exit and management opportunities. An Info button (i) is added to on the Alert Management Page to assist/guide users on the criteria offered.
Set Alerts by Watchlist as well as individual symbol.
Trade functionality is available from the Charts, streamlining the process when you have an existing trade or staged trade. Where there are more than one position on the same symbol, you’ll be given the option of what action to take.
Increased Alert Functionality
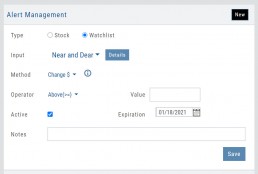
Set Alerts by Watchlist
You are able to set Alerts on your Personal Watchlists . There are 2 ways to do this:
1. On the Watch Tab using the Alert Icon in the Icon bar
2. The Alert Management Page, click “Watchlist”, then select from the drop-down which will automatically populate available lists to choose from.
Criteria available for single stock/etf symbols are available to set for an entire watchlist, include Real Time, up to 6 month activation and the ability to add Notes.
Clicking the “Detail” button will display the symbols contained in the selected Watchlist

With the exception of Last Price, all Methods are available for both individual alerts as well as Watchlist Alerts.
Simple Moving Average
Exponential Moving Average
Bollinger Bands
Keltner Channels
6 Month Hi/Low
52 Week Hi/Low
As you see, SMA & EMA offer numerous time periods. The shorter the time period, the more alerts you will receive – especially when set on Watchlists.
Note: The Active Alert box on the left side of the Alert Management page will have ‘wl‘ indicated when the alert is on a Watchlist.
A Reminder on Alerts:
Alerts are RealTime if you have Streaming Quotes on the platform – OR – have a linked brokerage account that provides RealTime quotes to the platform – AND – have logged into that account in the last 30 days.
Alerts on OTC stocks will be delayed
Make sure to enable “Push Notifications” on your computer as well as mobile devices (if you have the app downloaded). You do not have to be logged into the platform to receive alerts as long as you have these notices activated.
Information Button – Alert Management Page
An Information Button has been added to the Alert Management page.
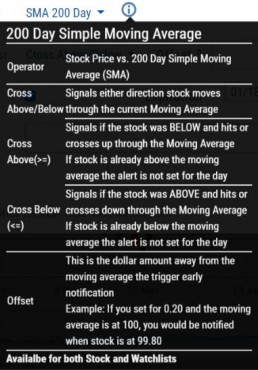
Located next to the Method drop-down, (i) clicking on this button will display in-depth information on criteria available to set your alerts.

Trade from Charts (Live, Virtual, Manual or Staged Orders)
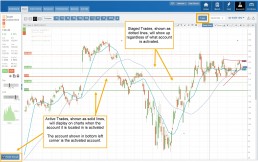
Submitting existing trades or staged orders is streamlined.
In the example chart above, there are two staged orders and a Live Trade.
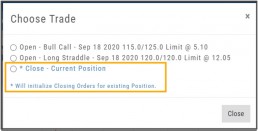
Clicking “Trade“, located above the stock chart , will display a menu of an existing trade(s) in the activated trade account.
Staged Orders, on the same symbol, will display regardless of the trade account activated.
Staged orders will be shown in bold/black.
Active trades, whether Live, Virtual or Manual will be shown lighter/blue.
To the right is what displays after clicking “Trade”:
1. Open (Enter) the Bull Call Position
2. Open (Enter) the Straddle Position
3. Close the existing Active Trade (Manual, Virtual or Live)
The next action will take you to the Order Ticket to continue the trade process, as usual.
Change Log
- Ability to save Backtested trades after Market hours restored
- Dividend display corrected
- Adjusted links in BZ news
- Mobile App – scrolling issue resolved in Scans
Premium Features Release: Custom Home Page & Alert Functionality
Features Release Notes:
Custom Home Page, Alert Capability
Announcing: New Powerful Premium Features Added to the Trade Tool Trading Platform
Two new features, exclusive to the premium desktop version of the trading platform have been designed and implemented to help you make better trading decisions and have more control in managing existing trades.
Custom is located in the redesigned former Market Tab and gives you control of features you want to see in one customizable location.
Alerts gives you more control of your trading by setting up notifications set by your criteria.
Both features allow for expansion on future releases.
Custom Home Page
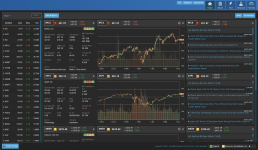
You now have a Custom Home page!
Located in the “Home” Tab (formerly Market), this is a flexible feature which allows for a convenient way to research trades or find opportunities – in one place – all defined by you.
Start by adding Widgets: Chart, Quote and News pertaining to the stock, and even Market News The platform system will automatically adjust according to the available space on your desktop/laptop.
Each symbol can have multiple Chart set-ups – each with their own time period, chart type and indicators.
Want to rearrange the widgets? Custom allows you to do so.
Want to keep the settings, but change the selected stocks quickly? That’s covered too.

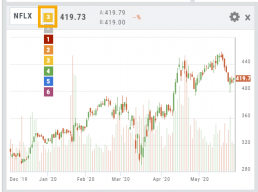
Alert Functionality
Alert capability gives you more control of managing existing trades or being notified of possible trade opportunities. Set by Last Price, $ or % Change, % Offset or Volume.
Receive triggered alerts on your computer and/or mobile device (with the mobile app).
Alert Management, located in Research, allows for easy modifying or removing active alerts from your current list.
Increase your profitability while minimizing risk on existing trades with this powerful feature!
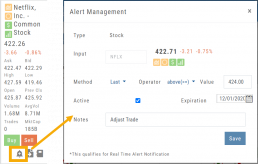
Alerts are easily set up from the Research Dashboard.
Click on the bell icon, located in the Quote Box,
Complete each field
Click “Save”
Quotes are RealTime if you have Streaming Quotes on the platform – OR – have a linked brokerage account that provides RealTime quotes to the platform – AND – have logged into that account in the last 30 days.
Change Log
- Researching Staged Orders resolved
- Adjustments/Building trades in Order Ticket issues corrected
- Deleting Snapshot trade in chain corrected
- Research/Dashboard/EPS data aligned
- Scroll bar improvement on PCs in Journal, Watch Lists
- Corrected “Position/Order Display” on Charts
- “Existing Positions” label displays on Charts
- Earnings display corrected when adding 10,30,60,90 periods
- TDA – History data updated
- TDA – Login resolved for Android mobile & Google Pixel
The Dashboard Scan Tab
Get the current ‘story’ on a stock.
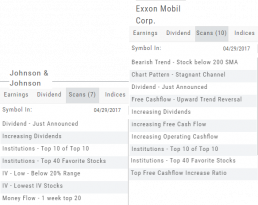
The Scan Tab is particularly interesting. In addition to providing a list of scans the stock is currently included in, it can give you a “story” about the stock. Based on the scans that the stock is showing up in, you can get an overview of outlook on the stock.
For example: JNJ shows solid longer term positive outlook.
XOM Shows stagnant with improving longer term outlook
Chart Navigation

Hovering the cursor over the icons will display it’s function.
In the upper right of the Chart screen, you can select which Chart Profile to research from the drop-down box, then save or delete the profile.

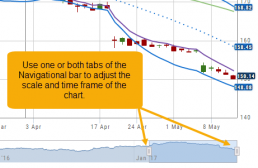
The next set of icons immediately below this gives more charting capabilities: Increase/Decrease price ranges, Reset price range, Hide/Show Navigation Bar, Move the date Back/Forward, Export/Print Chart
![]()
Overview & News
Located in ‘The Dashboard’, the Overview provides a snapshot of the company, including the Sector and Industry. By clicking on the Industry link, a list of stock symbols in the same category will appear. The “Stock Detail” list will have current market information and The Score navigational icons.
The News section lists articles covering, related to, or mentioning the selected Company. Click on any headline to be linked to the full article.
Sending from One “List” to Another
You can send symbols from any list, including Find, Explore, Actives, to your Watch lists — including from one watch list to another.
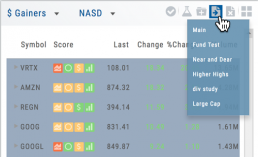
Simply (1) click the “Check” icon, (2) select the symbol(s), (3) click the “Page/Arrow” icon and select the List you want the selections sent to.
You can also ‘Click & Drag’ – highlighting a group of symbols you want moved to another list, or to the Research Tab.
Note: Research can handle up to 20 stock symbols at a time.
Don't Know the Symbol?
No Problem
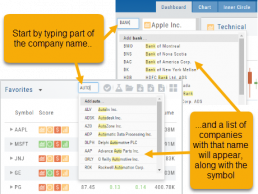
You can search for symbols from several entry points including “Market” and “Watch”. Simply start typing all or part of the Company’s name and the system will proactively provide you with suggestions. You can use this feature anywhere including Insiders and Institutions.
For example, typing “Bank” in the Symbol box will bring up the stock symbols and names of companies with “bank” in their name.
Depending where you are in the Platform, clicking on the selected symbol while you are in:
The “Market” or “Watch” tab, it will be added to your currently open list of stocks.
The Dashboard of the “Research” Tab, it will automatically provide the top layer of information on the stock. As always, you are able to navigate to different areas or ‘drill down’.
Insider or Institutions of the “Research” Tab, the corresponding data will display, such as data by Quarter, the biggest buyers and sellers and more.
Trade Transaction Types
Rule 16b-3 Transaction Codes
A — Grant, award or other acquisition pursuant to Rule 16b-3(d)
D — Disposition to the issuer of issuer equity securities pursuant to Rule 16b-3(e)
F — Payment of exercise price or tax liability by delivering or withholding securities incident to the receipt, exercise or vesting of a security issued in accordance with Rule 16b-3
I — Discretionary transaction in accordance with Rule 16b-3(f) resulting in acquisition or disposition of issuer securities
M — Exercise or conversion of derivative security exempted pursuant to Rule 16b-3
Derivative Securities Codes (Except for those exempt pursuant to Rule 16b-3)
C — Conversion of derivative security
E — Expiration of short derivative position
H — Expiration (or cancellation) of long derivative position with value received
O — Exercise of out-of-the-money derivative security
X — Exercise of in-the-money or at-the-money derivative security
Other Section 16(b) Exempt Transaction and Small Acquisition Codes (except for Rule 16b-3 codes above)
G — Bona fide gift
L — Small acquisition under Rule 16a-6
W — Acquisition or disposition by will or the laws of descent and distribution
Z — Deposit into or withdrawal from voting trust
Other Transaction Codes
J — Other acquisition or disposition (describe transaction)
K — Transaction in equity swap or instrument with similar characteristics
U — Disposition pursuant to a tender of shares in a change of control transaction
Valuation
Is it Overvalued or Undervalued?
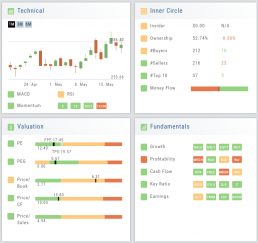
Valuation looks at Key Ratios and Projected Price to evaluate the stock’s current value.
Key Ratios like both trailing and forward PE along with PEG (Price/Earnings/Growth) are weighed.
The Price compared to Book (flow of business), Cash Flow, and Sales are also very important factors to provide a well-rounded synopsis of the valuation modeling of the stock.
Advanced Indicators
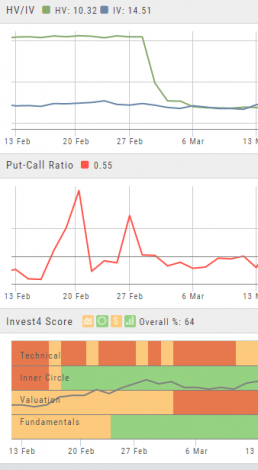
We offer select Advanced Upper and Lower Indicators that are not just derived from the price, including proprietary indicators like “Invest4Score” and “Insider Score”. They are accessible by using the “Add Indicator” drop-down box.
Upper Indicators include:
- Event Flags – showing Earnings and Dividends
- Journal Display
- Support/Resistance
- Extrema Trend Lines
Lower Indicators include:
- Historic Volatility/Implied Volatility
- Insider Score
- Institutional Percentage
- Invest4 Score
- Momentum Score
- Open Interest
- Options Volume
- Put Call Ratios

