Scans - Find Opportunities - Overview
Stagnant? Uncertain? Bearish or Bullish? Short or long term? No problem!
This “Find” category is where to find opportunities based on current Market activity and outlook, or select opportunities based on events, such as Earnings or Dividend announcements.
Whether looking for opportunities based on The Score, Events, Chart Patterns, Bullish, Bearish, Stagnant or Unknown outlook, a scan will help you find potential trade opportunities. 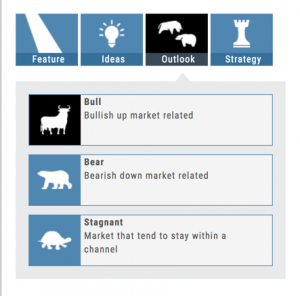
You can drill-down for scans by Category, Sub-Categories, then Group.
Example: Strategy>Time Spreads>Call Calendar Spreads. You can use the drop-down box, above the Category boxes to search for the scan you want or type in the box a generality about the scan. Examples: “Earning”, “Bull”, “Bearish”. “Score”, “Red”, “Green” will yield scans with that particular name in the scan
Designed to provide the level of information you want
As much information you want. When you want it.
Each of our scoring algorithms are derived from several factors, all captured in a user-friendly format.
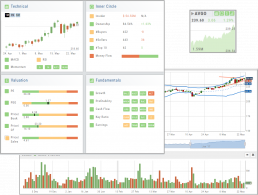
The stock dashboard provides a more detail summary layer view of The Score. Each component: Technical, Inner Circle, Valuation and Fundamentals allows you the ability to obtain the information you want, when you want it – and kept tucked away, when you don’t.
The Dashboard Scan Tab
Get the current ‘story’ on a stock.
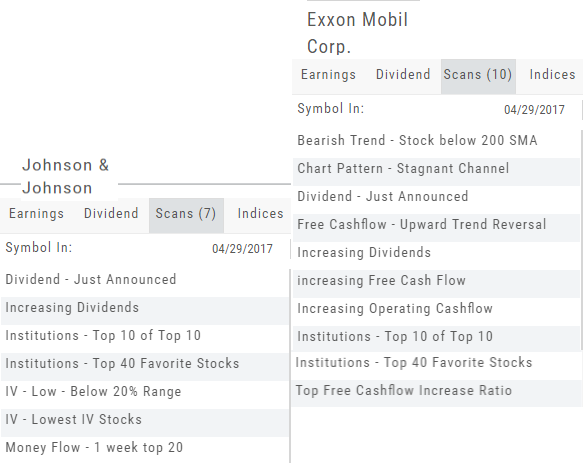
The Scan Tab is particularly interesting. In addition to providing a list of scans the stock is currently included in, it can give you a “story” about the stock. Based on the scans that the stock is showing up in, you can get an overview of outlook on the stock.
For example: JNJ shows solid longer term positive outlook.
XOM Shows stagnant with improving longer term outlook
Create Watchlists
The Market & Watch Tab Icon ToolBar allows you to Create/Modify/Manage your Lists.
Hover your cursor over the icon to view it’s ‘task’: 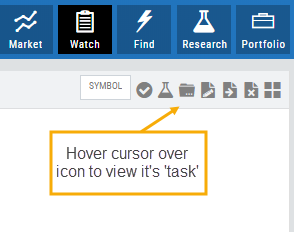
Select Candidates
Send to Research
Create/Delete a List
Modify an existing List
Send candidates from one List to another
Remove candidates from existing List
Change View: List or Tile
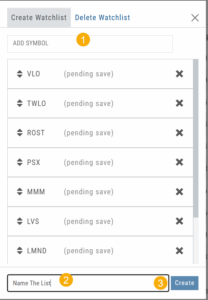
To Create a New Watchlist:
1. Under ‘Create Watchlist’, enter symbols to automatically add
2. Enter the name of New Watchlist
3. Click “Create”
Other ways to Create Lists include:
Research>Chart>”Recents” list.
From the Find Tab>Scans and Find Tab>Calendar.
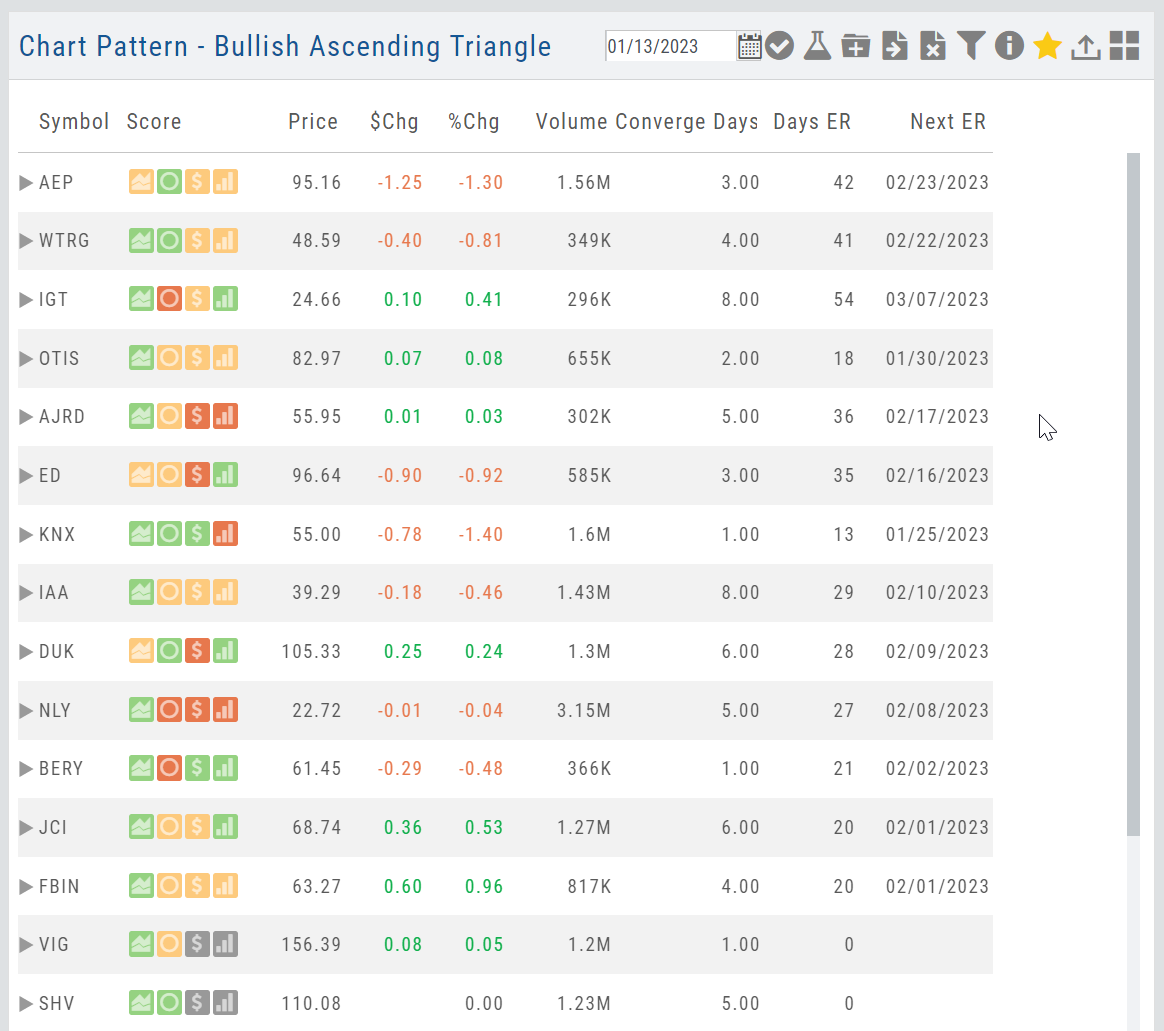
Selecting candidates from Scans (Ex: Bullish Ascending Triangle ) or Calendar for an Earnings or Dividend date to get the list of stocks that fit your selected criteria, click the “Check” icon to the stock symbols you want to keep, then click the Folder + icon to , name your new Watch List then click “OK”.
You can also copy/paste up to 100 symbols from an outside source to a newly created (or existing list) provided the following apply:
The symbols are separated by:
A Space: TSLA ZM GOOG NFLX
Or by a Comma: TSLA,ZM,GOOG,NFLX
Or a Return:
TSLA
ZM
GOOG
NFLX
Score Navigation
There’s more than one way to get the information you want.
Anywhere you see a Score Icon, you can navigate directly to the corresponding function of Technical Analysis, Inner Circle, Valuation, or Fundamental research – with a single click on the icon.
The Top 4 Categories
The names may be different, but the scans remain the same! 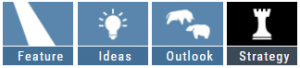
Feature – Your favorite and our highlighted scans, including scans related to The Score.
Ideas – Scans for general ideas including Dividends, Money Flow, Volatility, Earnings and more.
Outlook – For Bearish, Bullish and Stagnant outlook conditions.
Strategy – Over 20 strategy-specific scans including Bull Put, Bear Call, Iron Condor and more.
Icon Navigation
More than a picture, icons will help guide you through the trading process.
This graphic shows the function of some of the icons found in The Trade Tool.
Hint: Most icons will display a short description of its function or purpose by hovering the cursor over it.
![]()
Chart Navigation
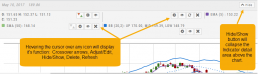
Hovering the cursor over the icons will display it’s function.
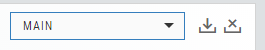
In the upper right of the Chart screen, you can select which Chart Profile to research from the drop-down box, then save or delete the profile.
The next set of icons immediately below this gives more charting capabilities: Increase/Decrease price ranges, Reset price range, Hide/Show Navigation Bar, Move the date Back/Forward, Export/Print Chart
![]()
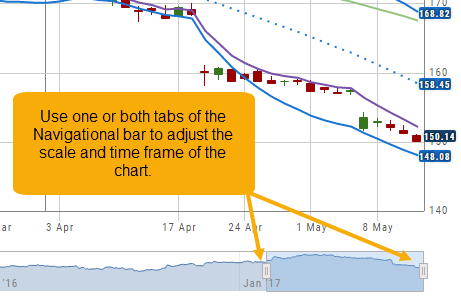
Other features include the Navigation Bar (below the chart). The shaded area corresponds to the chart time period. Slide one or both tabs of the bar to adjust the time period covered.
The “Hide/Show” button near the top-right of the screen will collapse the Indicator Detail area above the chart.
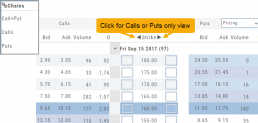
Chain Views
Different views are available for options such as Calls + Puts, Calls only or Puts only. Select from the drop-down box or toggle the screen using the arrows ![]() in the chain header.
in the chain header.
In addition, there are over 20 strategy templates on the Options tab.
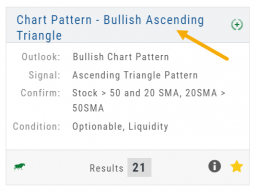
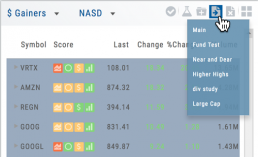
The Tile
The Scan Name and number of results are displayed on each Tile. Click on the ![]() on the upper right corner of the screen to display Scan Criteria.
on the upper right corner of the screen to display Scan Criteria.
Click on the name of the Scan Header to view results.
Use the toolbar icons on the results page to Research, send to a Watchlist, Filter, etc.