Compare Tab
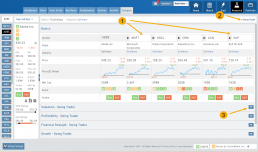
The Compare feature, found under the Research Tab, allows investors to review a particular stock against its industry peers. Different Views offer Investors perspectives with different investment strategies, such as value or growth investing, to identify stocks that align with their preferred strategies within a specific industry.
Some of the Compare benefits include:
- Relative Valuation: Ratios like price-to-earnings (P/E), price-to-sales (P/S), or price-to-book (P/B) can be assessed whether a stock is overvalued or undervalued relative to its peers.
- Identifying Outliers: If a company has significantly different ratios compared to its peers, it may warrant further investigation to reveal potential investment opportunities or risks.
- Industry Trends: Analyzing ratios across an industry can reveal trends and patterns. For example, if the majority of companies in an industry experience a declining profit margin, it may indicate a broader industry challenge or trend.
- Risk Assessment: Comparing key ratios can help assess the financial health and risk profile in an industry context. Companies with lower debt-to-equity ratios, for instance, may be considered less risky, especially if this trend holds across the industry.
- Operational Efficiency: Comparing Ratios like return on equity (ROE) and return on assets (ROA) among industry peers can provide insights into a company’s operational efficiency.
NOTE:
While comparing key ratios within an industry offers valuable insights, it’s VITAL to consider other factors , such as the company’s business model, competitive advantages, management quality, macroeconomic conditions, etc. Ratios should be only part of a broader analysis to make well-informed investment decisions.

The fields automatically populate with industry peers. They can be changed to compare other symbols of your choice.
