Platform Features Release: April 2023
Announcing the latest feature(s)/function(s) updates, additions, or edits to the trading platform:
Cloning and Editing Trendlines
New Trendline Customization
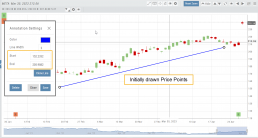
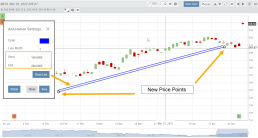
Clone trendlines with the push of a button. Easily define or edit trendline endpoints.
Click on an existing trendline to display the Annotation Settings box, make your changes, then click “Save”.
Enhancements
- Reusing canceled GTC Order preserves Duration
Change Log
- Repaired contrast on Find>Scans>Filter table
- Chart crosshair behavior resolved
- Pivot Point indicator editing restored
- Removed duplicate Inner Circle>Insider Information
- Platform Notification>“Don’t show again” fixed
- Backtest>Analyze Date selection repaired
- Corrected date display above chart
- Seasonality Chart behavior corrected
- Screener functionality repaired on several items
- Hide function on Option functionality restored
- Russell 2000 restored on Find>HeatMap
- Backend fixes on previous releases
- Net Debit/Credit responsiveness restored on Manual Accounts
Platform Features Release: March 2023
Announcing the latest features/functions updates, additions, or edits to the trading platform:
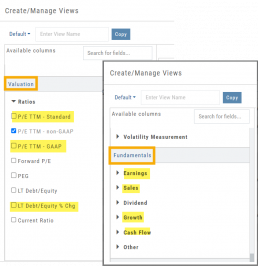
Valuation and Fundamental Data Points added
Users have more criteria to select from for both the Screener, to find potential trade candidates, and Watchlist Views to analyze candidates.
Valuation and Fundamental Data Points Added
Watch List Views
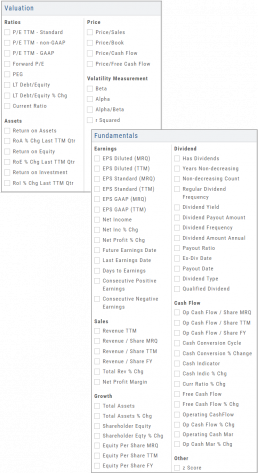
Over 30 data points were added to the Valuation and Fundamental sections for Watch List Views.
Build, Save, and Edit your customized Watch List Views to your needs.
Learn how to use this feature:
Screener
Over 30 data points have been added to the Screener Function under the Valuation and Fundamental sections.
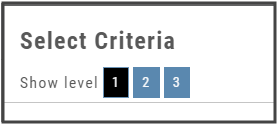
There are 3 Levels of Data Points. Level 2 has more Data Points than 1, Level 3 has all criteria available to select from.
Now users have more tools to choose customize screens. These may be saved and edited at any time.
Enhancements
- Added Average Volume line to (upper) Volume Indicator
- Saving Annotations/Texts, etc on charts are an automatic function. It no longer has to be selected.
- Scroll function added to lists on Custom, Market and Watch pages
- GAAP/non-GAAP PE/PEG (TPE and PE chart in Valuation section to reflect GAAP PE)
Change Log
- Resolved Screener Export Function
- Open/Close “save” function fixed in Backtest mode
- 2nd email saving in Notification feature setup
- Candlesticks and Volume bars line up
Heat Map Data Points
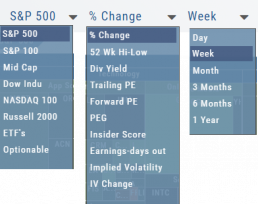
Drop-down menus allow you to select Index, Time Frame and various Data Points. Choose among % Change, Dividend Yield, PEG, 52 week High-Low and more.
Special Maps like Insider Score, Days to Next Earnings, and Implied Volatility are also included.
And of course, by selecting an individual box (stock) for Quote Detail and use the Navigational Icons to Research, add to Watch Lists, Submit a Trade, etc.

