
26-09 Release Notes: Chart Period Controls, Journal Trade Results, Strategy Metrics
TradeTool Platform
Release Notes
Chart Period Controls
Interval and Timeframe are now set independently, giving you more flexibility when setting up your charts.
What's new
- Interval determines how each bar or candle is displayed — Daily, Weekly, Monthly, 1 Min through 60 Min, 2 Hours and 4 Hours.
- Timeframe determines how much historical data is displayed — 1 Day through 10 Years.
- Extend By 10, 30, 60 or 90 periods is now available within the Timeframe menu.
- Your selections are sticky — they remain in place until you change them.
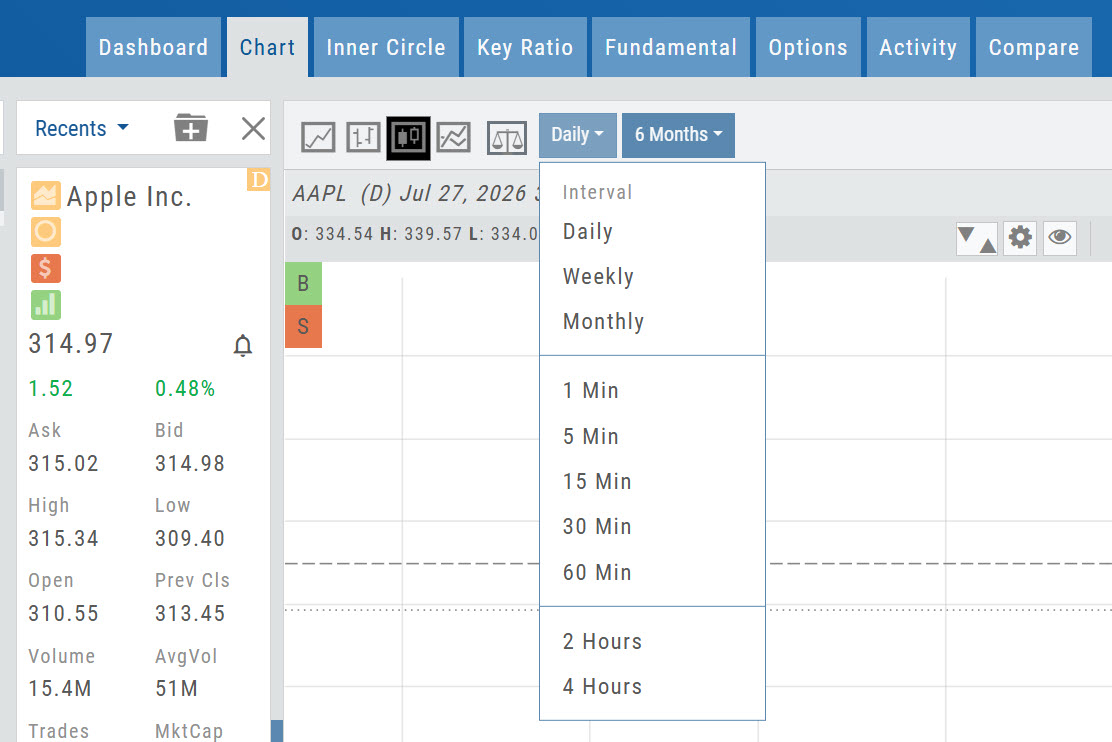
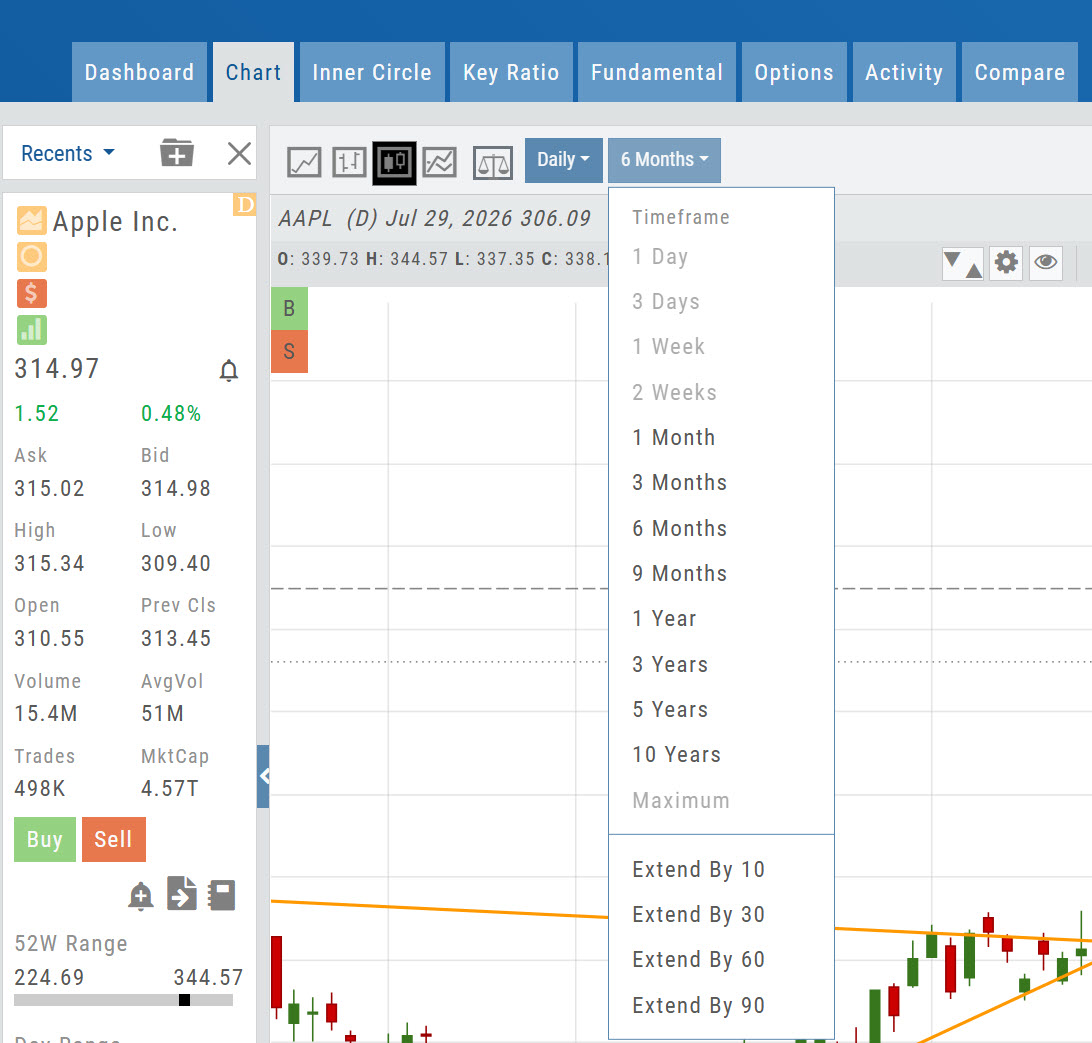
How the two menus work together
Compatible selections are shown normally, while unavailable combinations are faded. Selecting a 1 Min Interval, for example, allows Timeframes of 1 Day, 3 Days or 1 Week.
About Favorites
With this release, Interval and Timeframe are two separate dropdowns rather than one multi-level menu. As part of that change, chart Favorites have been removed for now. They will return in the next release, and your saved Favorites will be restored with them.
Helpful hint
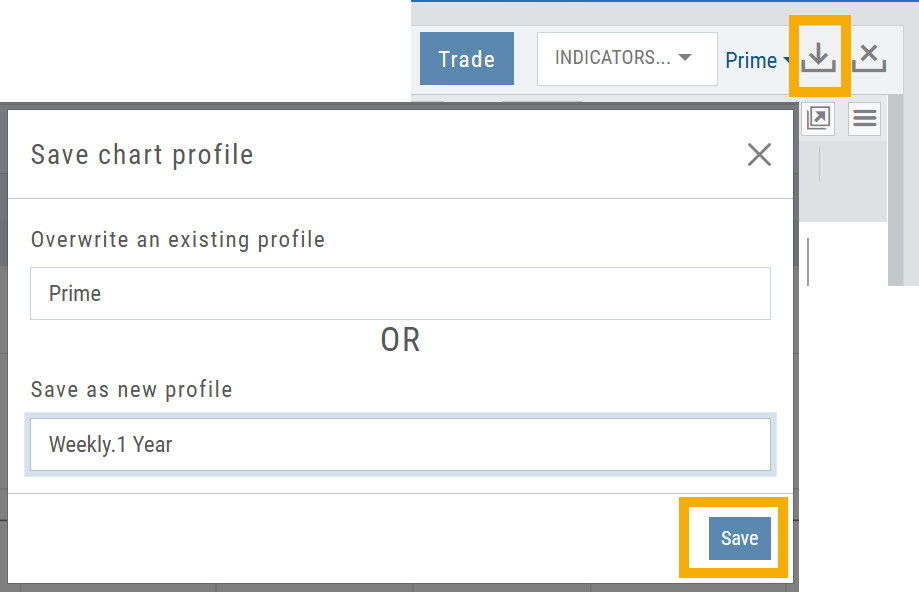
Save your favorite Interval and Timeframe combinations as Chart Profiles for quick access. You can overwrite an existing profile or save the settings as a new one — for example, “Weekly 1 Year.”
Enhanced Trade Results in the Journal
The Trade Journal provides a more complete view of your trade results — from entry through close, including adjustments and expirations along the way.
How to open it
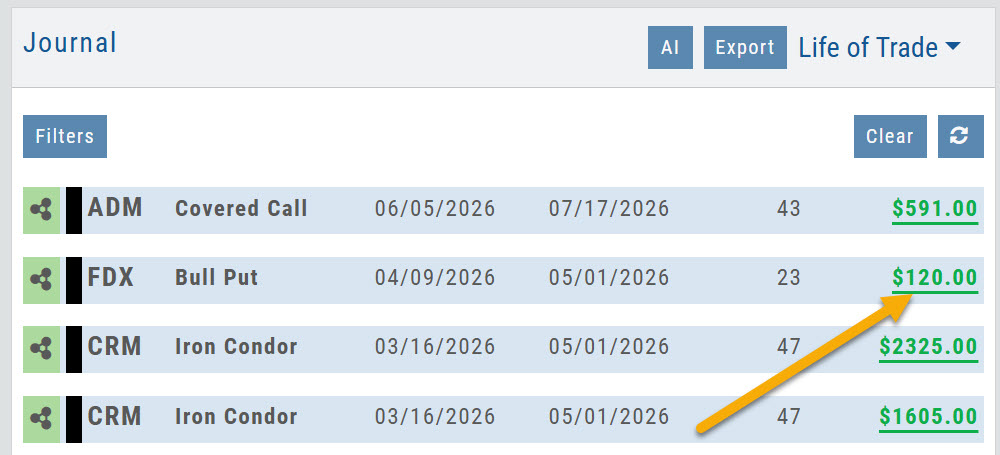
From the Life of Trade view, click the Gain/Loss value on the far right of a completed trade.
What you'll see
- Trade performance at a glance — Profit/Loss, % of Target and trade duration.
- Visual trade history — entries, adjustments and exits shown directly on the chart, including OCO Stop and Limit orders when applicable.
- Risk & Return — compare the original trade plan with the actual outcome, including Reward and Return on Risk.
- Performance Evaluation — identify the factors that contributed to or detracted from the trade.
- Position & Plan details — see how the actual execution and results compared with the original plan.
- Options Trade Analysis — review key Greeks and volatility metrics, including Delta, Theta, Vega, Gamma, IV and IV Rank.
The tabs you see depend on the type of trade.
Stock trades
Summary · Risk & Return · Position & Plan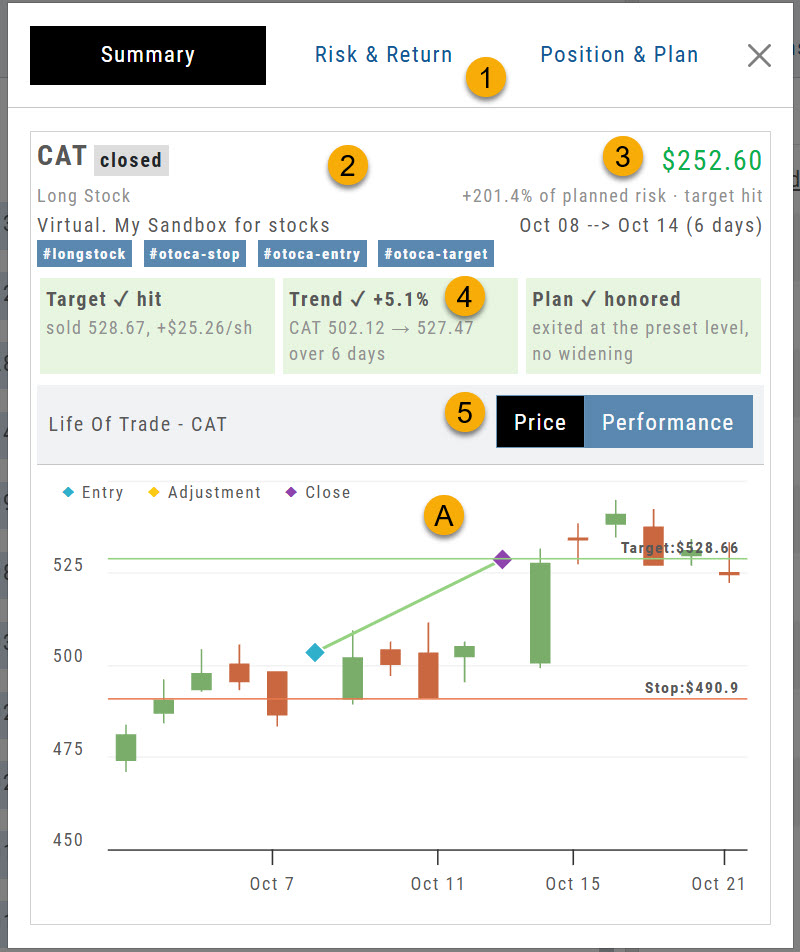
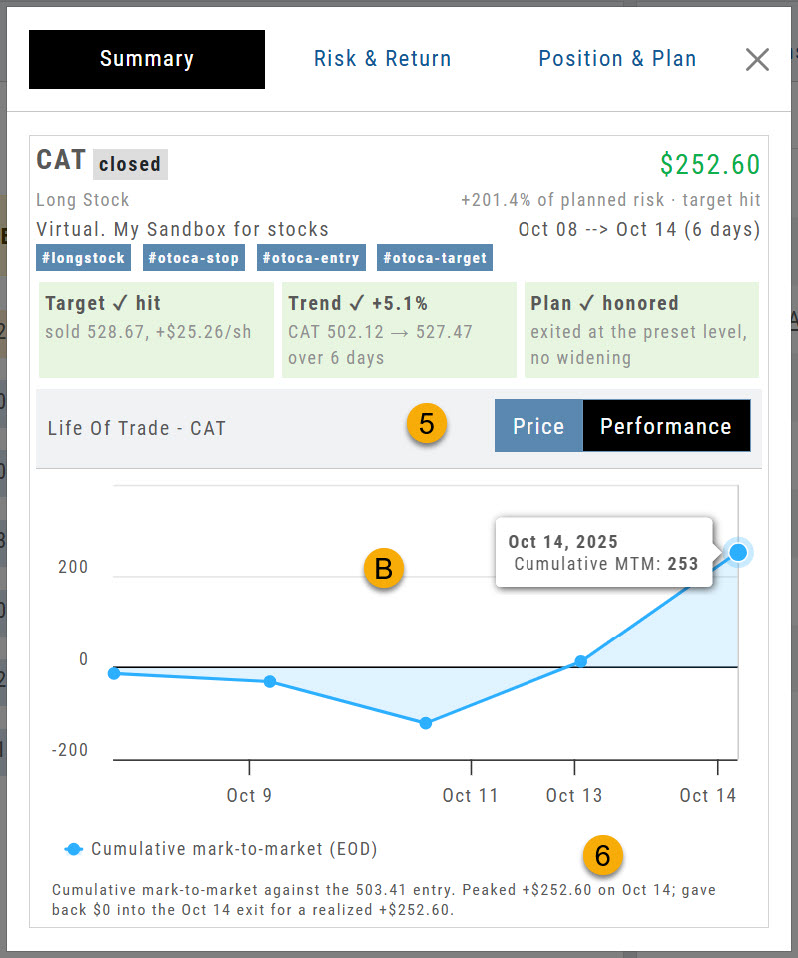
- Overview tabs — Summary, Risk & Return, Position & Plan.
- Trade summary — symbol, trade status, position, account and tags.
- Results — Profit/Loss, % of Target and duration of trade.
- Evaluation — color shows whether a factor contributed to or detracted from the trade.
- Price / Performance — toggle between the two chart views.
- ACandlestick chart with position entry, adjustment and close — plus OCO Stop and Limit, if applicable.
- BCumulative activity across the trade duration.
- Summary of performance — a plain-language recap of the result.
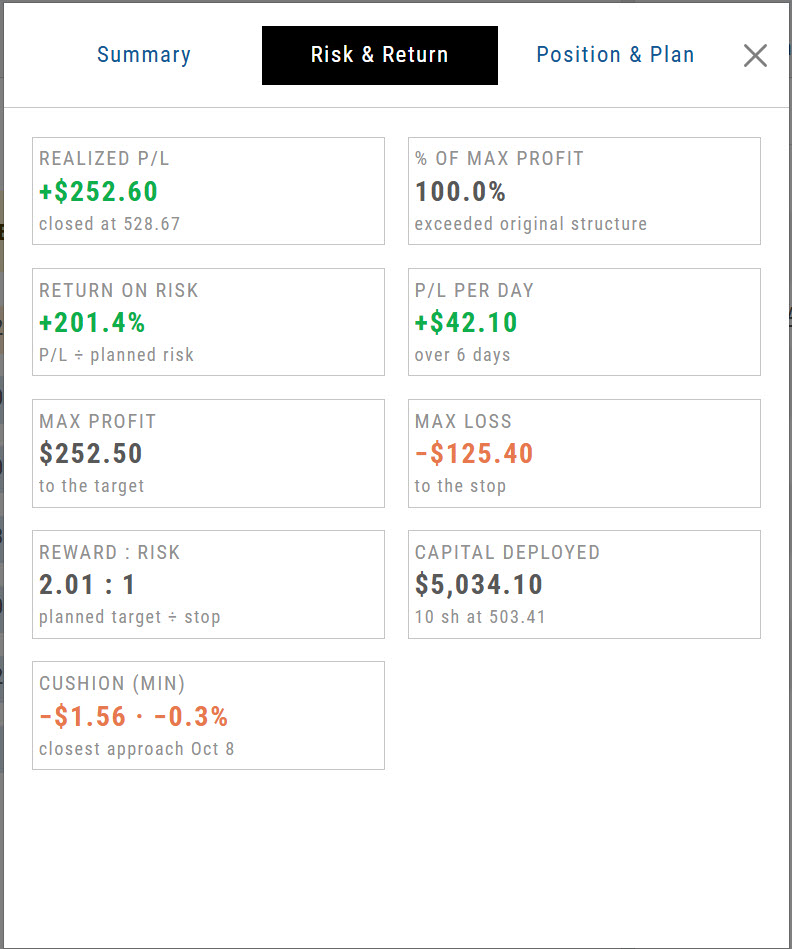
Risk & Return
Risk & Return sets the plan against the outcome. In this bracket order, 10 shares filled at $503.41 — below the $503.44 order price. Six days later the $528.66 target was reached and the close executed at $528.67, and the $490.90 stop was cancelled automatically. A planned Reward/Risk of 2.01 came in at 2.02.
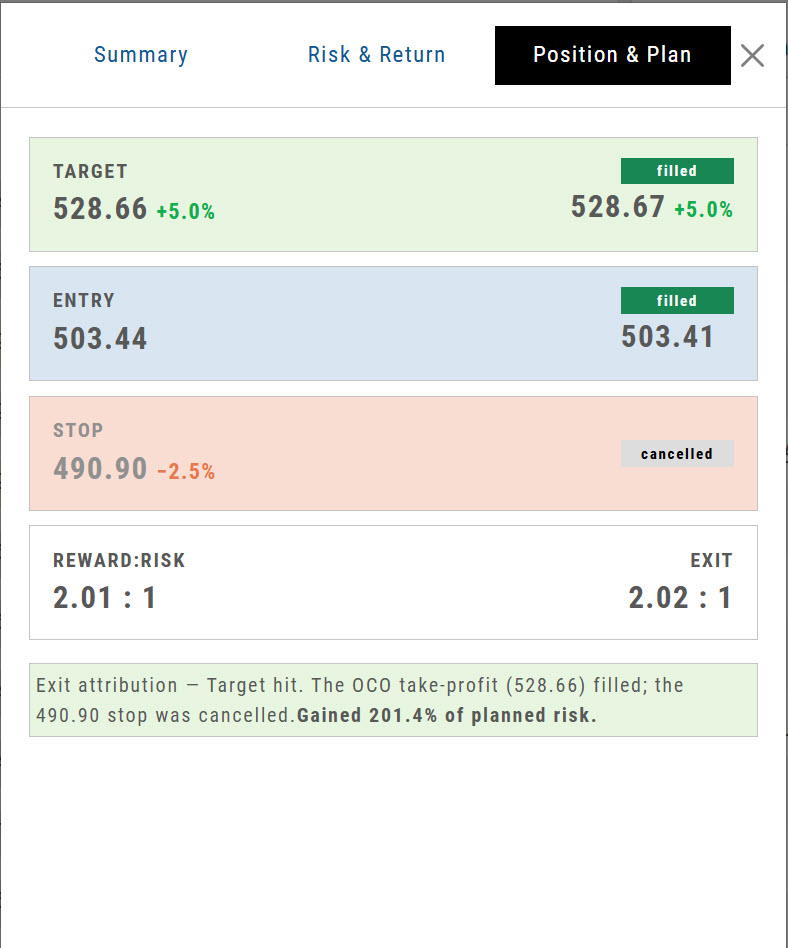
Position & Plan
Position & Plan breaks the result down line by line — here, a better entry, a better close, and a stop that never had to fill.
Options trades
Summary · Risk & Return · Greeks & IV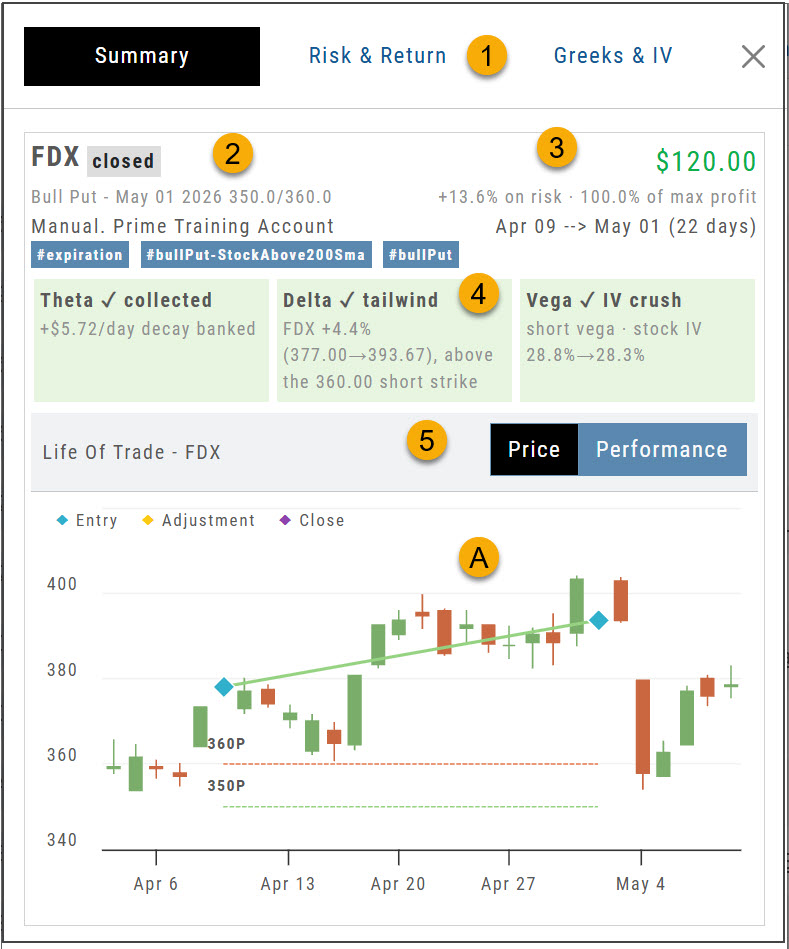
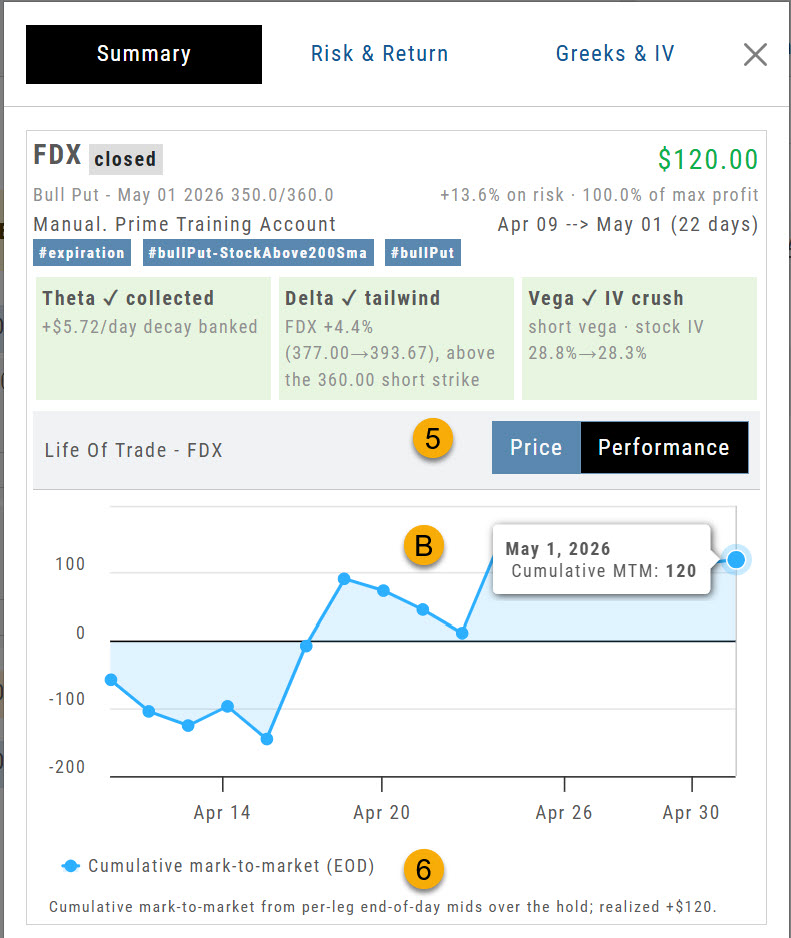
- Overview tabs — Summary, Risk & Return, Greeks & IV.
- Trade summary — symbol, trade status, position, account and tags.
- Results — Profit/Loss, % of Target and duration of trade.
- Evaluation — up to three primary drivers of the trade.
- Price / Performance — toggle between the two chart views.
- ACandlestick chart with position entry, adjustment and close.
- BCumulative activity across the trade duration.
- Summary of performance — a plain-language recap of the result.
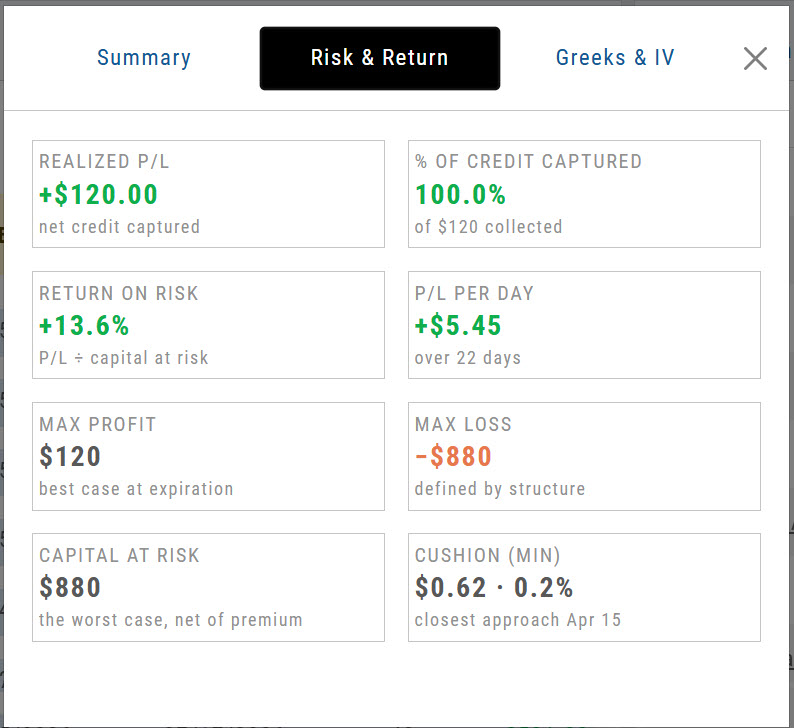
Risk & Return
For this $10 bull put spread: max profit $120 against max risk $880, held 22 days for $5.45 per day and a 13.6% return on risk. Cushion shows how far below the break-even point the trade reached.
Greeks & IV
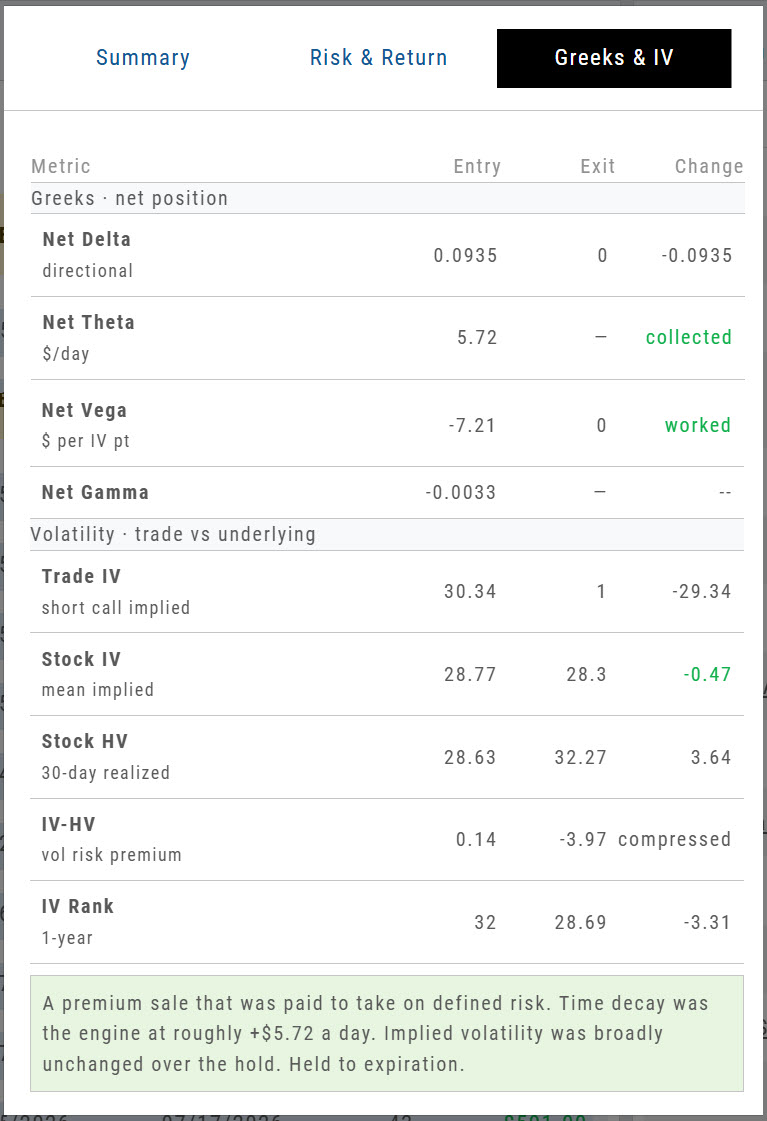
| Metric | What it tells you |
|---|---|
| Net Delta | Directional exposure — roughly what the position gains or loses per $1 move in the stock. |
| Net Theta | Premium in dollars per day that the position collects or pays for each day it is held. |
| Net Vega | What the position gains or loses per one-point change in implied volatility. |
| Net Gamma | How fast Delta itself moves as the stock moves — negative for credit spreads and short premium. |
| Trade IV | The implied volatility of your own legs — what you actually sold or bought. |
| Stock IV | The underlying's mean implied volatility, with 30-day historical volatility shown beneath it. |
| IV − HV | Volatility risk premium — how far implied sat above or below what the stock has actually been doing. |
| IV Rank | Where implied volatility sat within its own one-year range, 0–100. |
Strategy Metrics on the Option Chain
Build a multi-leg strategy on the Option Chain and the figures that decide whether it is worth taking are calculated as you go.
The callout bar sits directly beneath the legs and recalculates as you add, remove or reprice them — so you can weigh a structure before committing to it. Below it, the payoff diagram plots profit and loss across the price range, with a separate curve for each date between today and expiration.
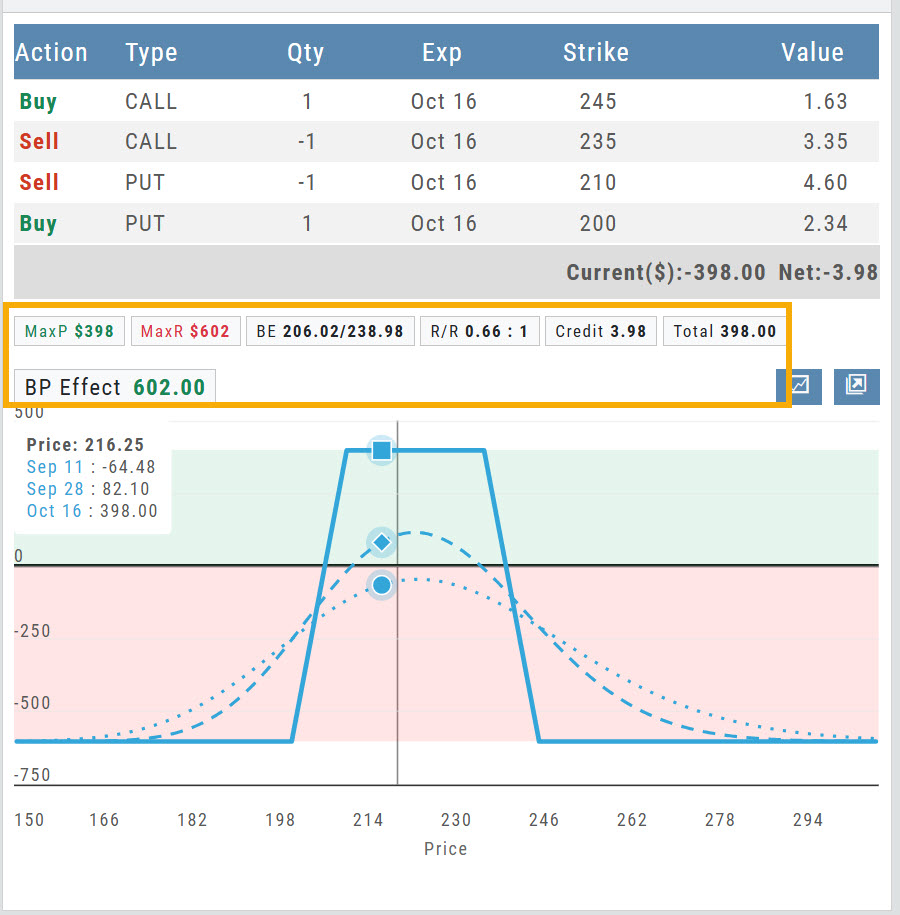
What the callout bar reports
| Field | What it shows | This example |
|---|---|---|
| MaxP | Maximum profit — the most the position can make. | $398 |
| MaxR | Maximum risk — the most it can lose. | $602 |
| BE | Breakeven price on each wing, lower and upper. | 206.02 / 238.98 |
| R/R | Reward measured against risk. | 0.66 : 1 |
| Credit | Net premium received — shown as Debit when you pay to enter. | 3.98 |
| Total | Cost to enter the trade; here, the credit collected. | 398.00 |
| BP Effect | Buying power the position ties up while it is open. | 602.00 |
Reward/Risk on the Order Ticket
The Reward/Risk ratio you set from the chart now carries through to the Order Ticket, so it stays in view while you finalize the order.
Set it from the chart
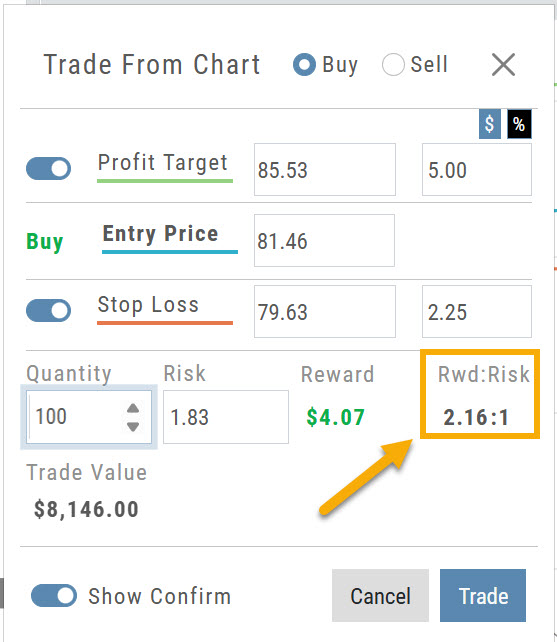
Click Trade from the chart to set up a Bracket Order. Set a Profit Target and Stop Loss around your entry price, and the dialog reports the resulting Risk, Reward and Rwd:Risk.
Then finalize on the ticket
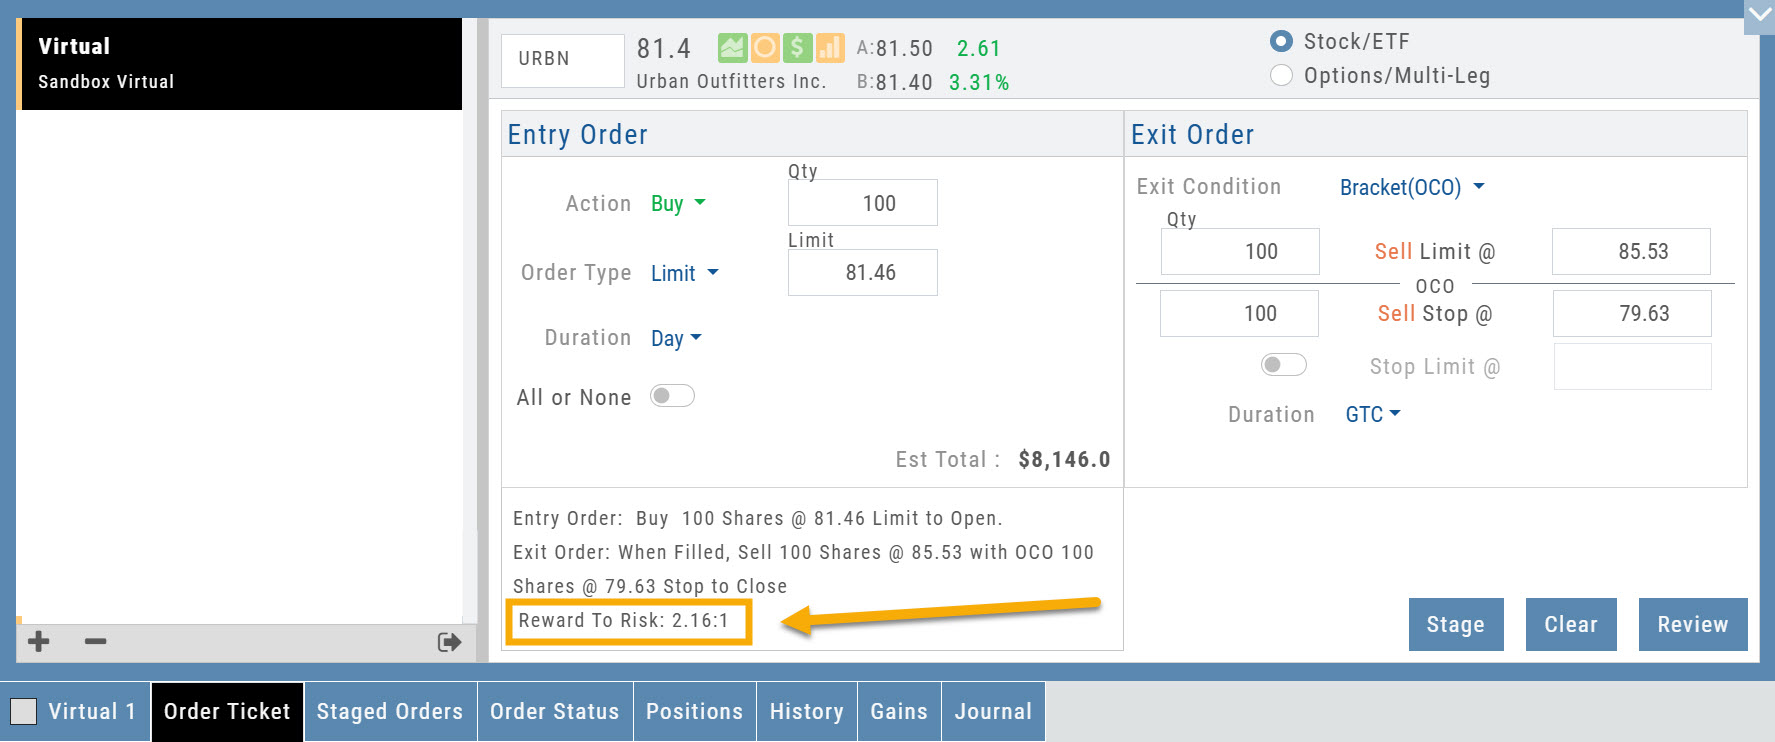
The Order Ticket now carries that same figure as Reward To Risk, printed with the order summary — so it stays in front of you while you review, stage or submit, rather than being left behind on the chart.
Almost Real Virtual Accounts
Built from the ground up to give you the most realistic experience possible.
Our new Virtual Accounts are designed to make practice trading more realistic — from the moment an order fills through expiration, assignment, dividends, and margin calculations. Whether you're learning the platform, testing a strategy, or practicing before putting real money at risk, your Virtual Account now gives you a much better picture of how trades can actually affect an account.
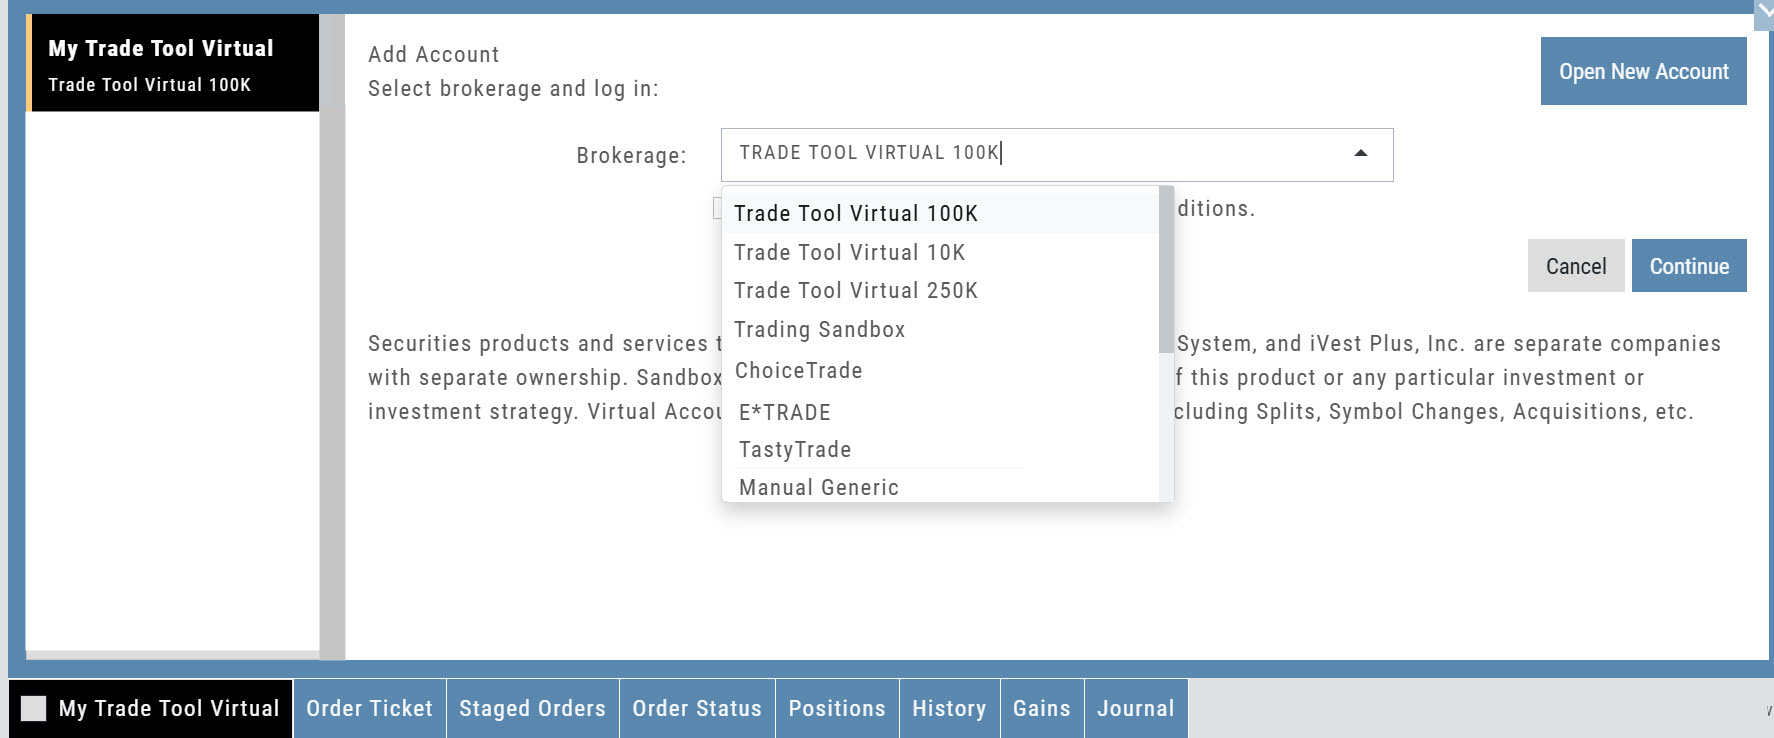
Available starting levels: $10k, $100k and $250k.
What's great about these accounts
- Realistic Fills — fast, market-based fills with potential price improvement, even on spreads.
- Accurate Margin & Buying Power — Reg-T margin and buying power are recalculated as your positions and orders change. Margin Interest is calculated at 10% for impact when used.
- Option Expiration & Assignment — options expire, exercise, and assign as they would in a live account, including cash-settled index options.
- Dividends — eligible positions now reflect dividend activity.
- Realistic Account Outcomes — margin calls, reduced buying power, and negative equity can occur when market conditions warrant them.
Change Log
- FixedTrend Drawing Tool — adjusting a drawn trend line.
- FixedRectangle Annotation — functionality restored.
- FixedLine Cloning — thickness now carries through to the cloned line.
- FixedPrice Slices — Tab key behavior.
- FixedScan Filters — filters now clear.
- ChangedBracket Orders — now function and display as a single order on the chart.
Trading Sandbox Account - Overview
Unlike traditional broker-provided virtual accounts, the Sandbox is not bound by brokerage margin rules or limitations, giving you more freedom to practice and test strategies.
Trading Sandbox Account was built specifically to overcome these shortcomings, allowing traders to:
-
Test advanced strategies without brokerage-imposed limits.
-
Gain confidence in how options positions will behave through expiration and assignment.
-
Track true results on completed trades for more effective learning and analysis.
As with other simulated trading systems, the Sandbox uses delayed market data. However, it goes beyond conventional paper trading platforms in several key areas:
Fast & Reliable Order Execution
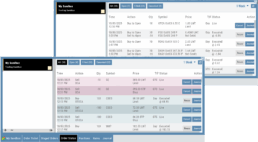
Orders are processed quickly during market hours, creating a more realistic trading experience compared to laggy paper trading systems.
Supports Conditional Orders for Stocks
Effortlessly include Stop and Limit Orders when buying stock.
Options Handling That Works
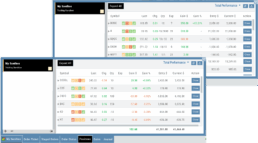
Options are properly assigned and exercised as they would be in a real account, removing the gaps found in most brokerage simulators.
Accurate Trade Capture
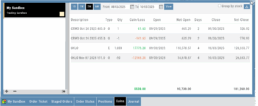
The Sandbox records and captures gains/losses on completed trades, giving you a clear picture of how your strategies perform over time.
Full Journal Support
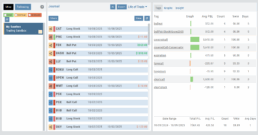
When auto-journaled (default setting) is set, all activity is captured. Track your progress to see what strategies work, what needs more practice, for important feedback.
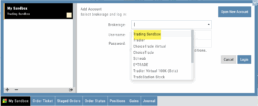
How To Add:
Sandbox has been added as a drop-down selection in the Portfolio section of your trading platform
-
Click the bottom left corner tab of the platform to display all account tabs
-
Click the “+” icon appearing below these tabs
-
Select “Sandbox” from the dropdown list. Check the “I agree…” box
-
Name your account and select a color identifier, if desired.
-
Start trading!
AI capability: Journal Analysis
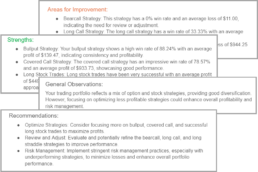
Journal AI Analysis – Now it’s easier to track your progress AND get feedback!
- Get observations and analysis on your selected portfolio accounts
- Recommendations offered to help improve outcome
- Flexible – select different time frames to compare results over time
Journal AI Analysis will review your account activity and provide insight, observations and recommendations.
Note: Analysis applied to closed positions only. This feature does not forecast unrealized gains or losses.
Your Journal AI Analysis will review your Trade Journal and provide insight, observations and recommendations.
Below are steps to get started.
Within a few moments, you’ll receive a summary of Strengths, Weaknesses, Observations, and Recommendations for improving results.
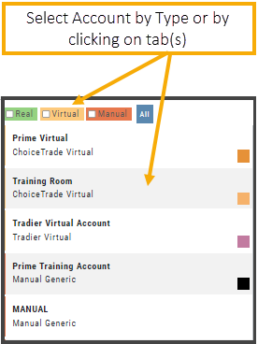
Select Account(s) to analyze by clicking on the Account Tab
OR
Select by Type: Real, Virtual or Manual
Tip: Keep the selection to a limited number of accounts for a more targeted analysis.
Click on the “Filter” Button from the middle panel
Select the date range to be reviewed. The default period is 12 months.
Add additional filters by selecting specific tags (#BullCall) and/or specific symbols
Click “Save” on the Filter Tab
Tip: You can change these settings, Save, then ‘refresh’ the report on the next step
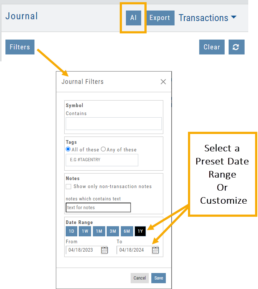
Finally, click the AI button at the top of the screen, then click the  button to get the report.
Important to Know
- Analysis is limited to closed trades. Make sure all trades in that account for the period covered have been reconciled.
- The report is available during your current session while you explore your Journal. If you change Accounts or revise any Filter settings, simply click the Run/Refresh button again.
- Iterate and Refine. Select different time frames to review results over time. Run reports to compare Real Accounts to Virtual ones.
As with all AI content, consider this as input. Make your own educated decisions
AI capability: Screener
Screener AI Assistant helps power your Research. Here are just a few ways how:
- Get criteria for customized screens based on market outlook, strategies and goals
- Learn about different strategies and how to apply them to your screener
- Interact and Refine screens for a tailored investment strategy
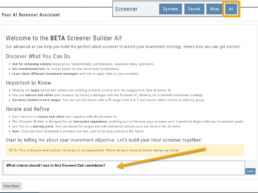
Located on the Screener page (under the Find Tab), click the AI button to enter your inquiry in the “Ask Me Anything” box at the bottom of the table, then click “Send“
Example: What criteria should I use to find Covered Call candidates?
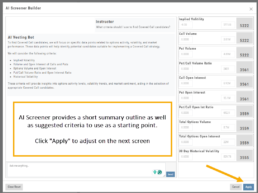
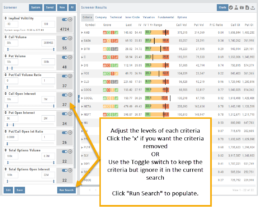
The Screener AI functions allow you the control to:
- Remove or Ignore suggested datapoints
- Save Screener AI searches
- Revise/Delete as needed
AI capability: Financial Coach
Use the Power of AI with a Financial Market Coach. Some of the applications include:
- Insight on trading strategies and applications
- Guidance on Risk Management techniques
- Market trend analysis
- Information access covering technical to fundamental access
- Management guidance to minimize risk and optimize returns
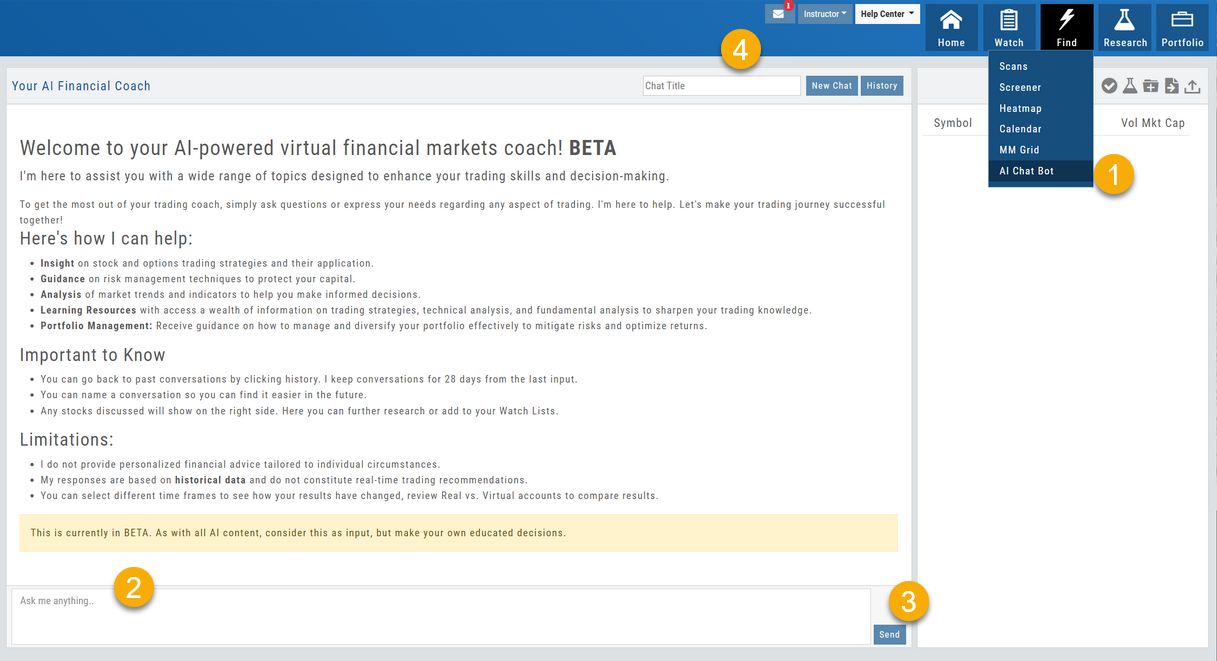
Located within the Find Tab, this powerful research tool can gather and deliver market-related information while staying within the platform.
- Select feature from the Find Tab
- Type your inquiry in the “Ask me anything” box
- Click “Send“. Refine by submitting additional questions, clicking “Send” after each one.
- To start a new Chat, click the “New Chat” button by the same name.
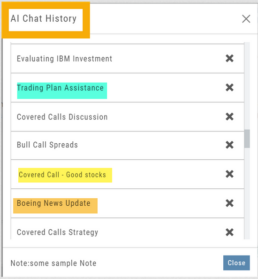
Each Chat result is automatically saved and accessed via the History button. The title is auto-generated based on the topic when the Chat is created. You can edit the title at any time.
Inquiry results that include symbols will be displayed on the right panel of the screen, allowing the ability to navigate to other areas of the platform for that symbol.
To remove any Chat, simply click the ‘x’ for that entry.
Enabling Notifications
Below is a general guide to enabling Notifications on your Desktop/Laptop and Mobile devices.
Please note: Settings/Configurations vary by device. It is important for you to be familiar with your system/device. When in doubt, refer to the Help function on your computer/phone. An internet search of ‘How do I…” for your device is also helpful.
Macs
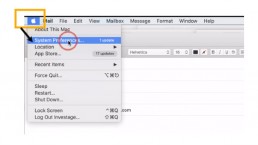
- Open the Apple Menu
- Select System Preferences
- Select Notifications
- Select Browser

Hint: While on the platform, click on the Lock Icon in the browser bar to check status of/enable notifications.
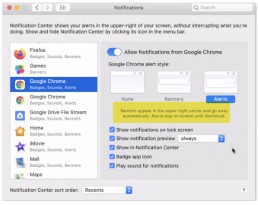
Customize how you want Notifications to display.
- Allow from Browser
- Banners or Alerts
- Allow Sound
- Sort functions – how often, when, what, etc.
iPhone/iPad
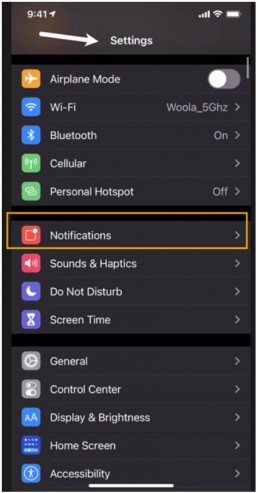
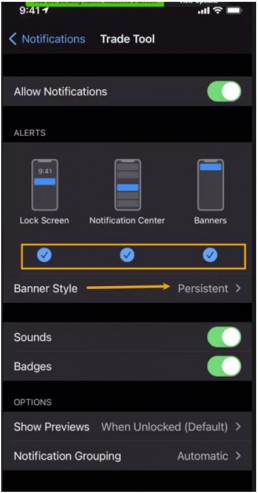
Follow illustrations: Settings>Notification>App>Customize
PCs
- Click the Windows Icon to access PC Menu
- Select Settings>System
- Select “Privacy & Security” on the next window
- Under “Notifications”, select either “Allow” or “Ask”
Hint: While on the platform, click on the Lock icon in the browser to check the Notification status
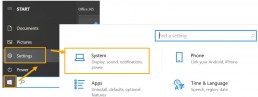
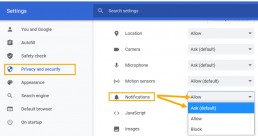
Android/Tablets
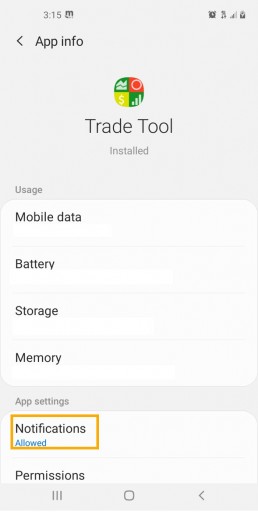
Follow illustrations: Settings>Notifications>Apps>Customize/Manage
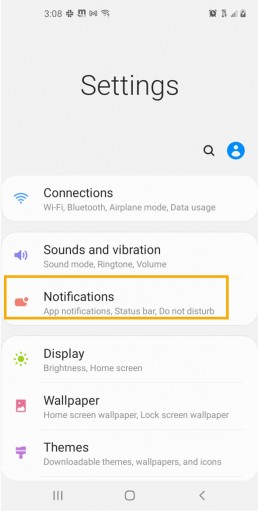
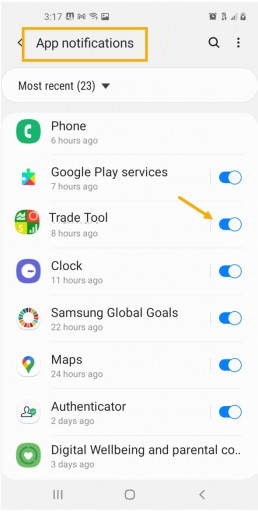
Select Background Theme
The Tabs on the Journal are Color Coded for Easy Understanding of the Trade
Primary Tab Color Coding (see below for expiration tab coding)
Note: Journal Tabs are automatically updated when you login to that account (Live) or simply select a Virtual or Manual Account. Orders/Trades are updated as far back as two months.
 Light Blue
Active Live Order
This indicates that you have a current live order
 Dark Blue
Trade – Open
This indicates the opening transaction of a trade
 Grey
Grey
Expired Order
This can be from a order that you canceled, or a day order that did not get filled
 Green
Green
Closed Trade – Profit
This indicates a trade that you closed for a profit
 Red
Red
Closed Trade – Loss
This indicated a trade that you closed for a loss
 Yellow
Closed Trade – Unmatched – Profitability not yet determined
You close a trade that the system could not automatically match
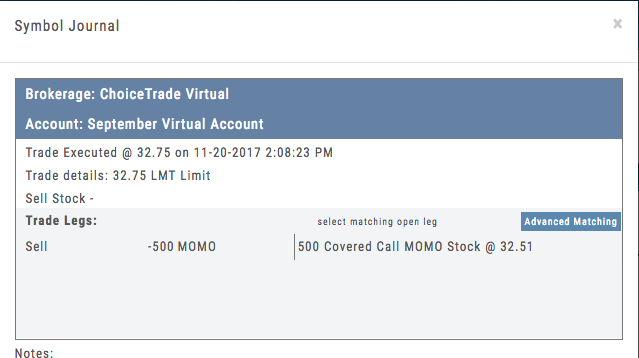 Unmatched Trades can happen if there are multiple trades and an entry trade needs to be identified or because a multi-leg trade was split on exit, or change of stock position when an option expired (exercise/assignment)
This is easily matched by clicking the edit icon (pencil) and selected which open order to match to. In some cases there may only be one, and it is simply a verification.
Expiration Tab/Tagging Colors
 Red or Green with No Color Tagging
This indicated the option trade expired Out of the Money (OTM)
There were no options exercised or assigned through expiration
 Red or Green with Dark Green Color Tag
This indicated that there were ITM options exercised/assigned
However, there was no change is stock ownership. Example: Bull Call where both legs were exercised/assigned.
 Red or Green with Yellow Color Tag
This indicates a change in stock ownership through exercise/assignment
This will happen with single leg options trade or where one leg of a spread was ITM at expiration
It is important to reconcile expired traded to properly display profit. If there are unreconciled expired options, the reconciliation window will automatically display when you go to the options tab.
Streaming Available in the Platform
Real Time Streaming Available
Real Time Streaming Data is available in the platform.
This will provide real time quotes with streaming updates.
Through our data partner, Quote Media, you can add real time streaming data.
There is a small cost associated with streaming.
The special introductory rate is $10 plus exchange fees, per month.
Exchange fees are currently $6.75 and include NYSE, AMEX, NASDAQ, OPRA (options), Dow Indicies.
How to Activate Real Time Streaming Data
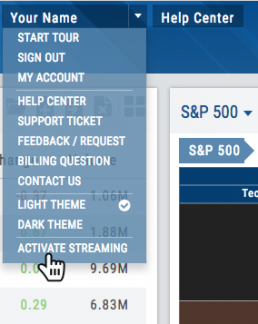
- Select Activate Streaming from your user menu in the header.
- Enroll in streaming on the following pages.
- Once enrolled, return to the platform and click Start Streaming.
Special Notice:
Streaming data provided by Quote Media and through your exchange agreements. Your agreement for streaming data is with Quote Media and you will be charged by Quote Media for this service.
Please note that streaming data is prepaid and is not refundable. Your initial Streamer Subscription will prorated for the balance of the month. However, exchange fees are not prorated and will be payable upon registration.
This Introductory Rate is for available for a limited time and may be withdrawn with/without prior notice. However, your rate will remain at the introductory rate.
Exchange and Real Time Fees are subject to change. Rate changes will be posted 30 days prior to effective date. User agrees to these fees as indicated above.
You can cancel any time by selecting Cancel Streamer from the user menu.
Enhanced Auto-Tagging 2017-11-09
Enhanced auto-tagging for Trade Journal released:
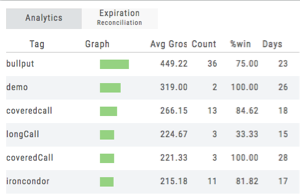
Our enhanced auto-tagging will identify the main options strategies and will automatically add the #tag to the Trade Journal. This includes identification of trades executed through the Options Chain as well as the Strategy Templates.
As part of our release process, we have tagged past trades for you.
Types of Auto-Tagging:
Identified Strategies #strategyName,
if the trade was an adjustment #adjustment,
if the close was through options expiration #expiration.
if the trade can from a scan, the scan name is also tagged.
What you should know:
If you wish to remove a tag, simply edit the Journal entry and remove the tag at the bottom by clicking the x next to the tag.
Tagging trades greatly enhances the value of your Journal Analytics. This will track your profitability by each tag. Future releases will further take advantage of tagging of trades for more in-depth reporting