Platform Features Release: Enhanced Annotation Capability and Indicator Settings
Announcing the latest features/functions updates, additions or edits to the trading platform:
Enhanced Annotation Capability
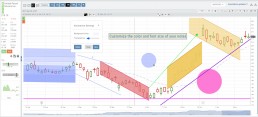
Additional features have been added to create Annotations, Trendlines and Notes on the Chart. Each can be customized by color, size and easily placed on individual charts.
Volume and Moving Average Indicator Updates:
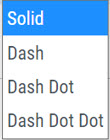
Users have the ability to further differentiate Moving Averages on the charts by changing the type of Line.
Volume can now be selected as an Upper Indicator and/or Lower Indicator
Enhanced Annotations, Trendlines, Notes & Fibonacci capabilities
Additional & Enhanced Tools for Charting
Enhanced Annotations, Trendlines, Notes & Fibonacci Retracements allow you to customize and edit for greater flexibility on your charting.
Rays, Horizontal Lines and Arrows have been added. All allow you to select the color and thickness of each for greater differentiation on the charts. Easily reposition with a simple click and drag to new location.
Notes can be text and color edited as well as repositioned.
Parallel Lines have been added and they, along with Fibonacci Retracements – allow you to customize the color and transparency on the charts.
Edits are easy: Click on the entry, edit as needed on the Annotation Box – which can be moved anywhere on the platform- as needed, to make any changes.
Volume and Moving Average Enhancements
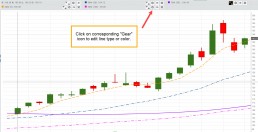
Customize your Moving Average indicator Lines – not only by color – but by the type of line:
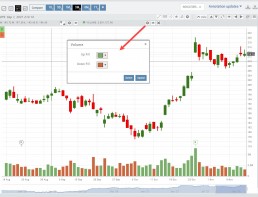
Volume, already available as a Lower Indicator, can be added as an Upper Indicator on the charts.
In addition, the Volume bar colors can be customized as they are an independent indicator from the candlesticks. This is done by clicking on the gear icon, as shown.
Change Log
- Added Stock/ETF symbol to Option Chain Window
Platform Features Release: New Option Chain Functionality/Appearance, Responsive P/L Graph
Features Release Notes:
New Option Chain Functionality/Appearance, Responsive P/L Graph
Announcing the latest features/functions updates, additions or edits to the trading platform:
Option Chain Functionality/Display has been revamped to allow users to control which information to view and increase responsiveness. Symbols, such as SPY and SPX, will load noticeably faster. An incorporated Dashboard provides a snapshot of current activity allowing users to make more informed decisions.
Responsive P/L Graph adjusts when the slide bar between Bid and Mid price is adjusted. This is especially helpful when the spread is considerable.
Option Chain Display/Functionality
Select Expiration Cycles
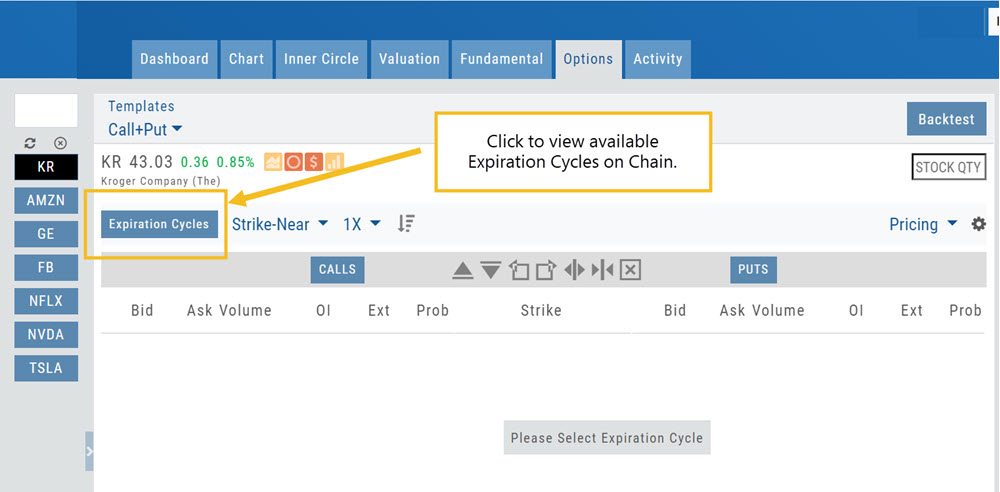
The redesigned Option Chain allows users control of what Expirations to view instead of the platform defaulting to a cycle approximately 30 days out.
Click on the Options Tab from Research.
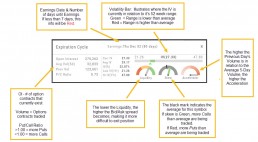
A window with available Expirations will appear along with a Dashboard with pertinent information (Volume, IV, OI, Earnings Date, etc) for more informed decision-making.
As a bonus, this structure allows data to load faster – especially helpful for those symbols with large option chains.
Responsive P/L Graph
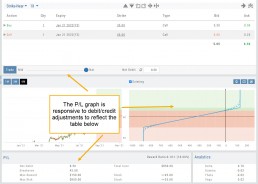
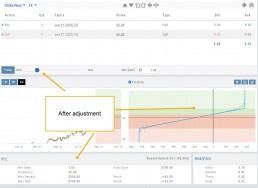
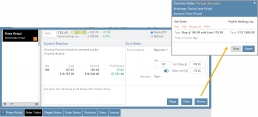
The P/L graph on the Options Tab is responsive to adjustments made to the trade set up for the entry Net Debit/Net Credit.
Note, the smaller the spread between the Bid/Ask, the smaller the graph adjustment will be.
The example illustrates a large spread to better illustrate this feature update.
Change Log
- Price representation on chart X/Y axis corrected
- Journal Notes enhancement
- Saved screeners adjustment
- Active Watchlist access corrected
- Close from Backtest saves Symbol
- Clarified wording on Warning Message
- Mobile version of Saved and System Screener
- Mobile app – rolling trade adjustments
- P/L ‘Go Big’ data correction
- Account Summary page enhancement
- Large number displays on HeatMap
Option Chain Functionality
Option Chain Video
Research>Option Tab, click on “Expiration Cycle” for the “Call+Put”, “Calls” or “Puts” view.
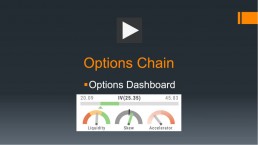
Option Chain Expiration Cycles
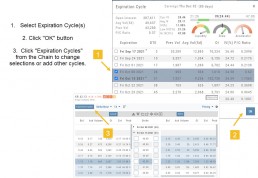
The Option Chain Expiration Table gives you control of selecting which Expiration Cycle(s) you want to view.
The Option Dashboard provides a wealth of pertinent information to make informed decisions easier.
See below for more detail
Expiration Cycles: All available options will be displayed. Monthly Options are indicated with an asterick![]()
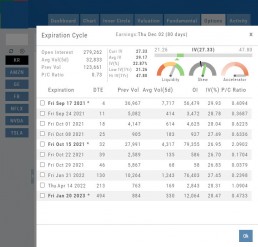
Select Expiration Cycles
Click ‘OK”
Chain will display for selected
Platform Features Release: Smart Trade Ticket, Global Chart Settings, Updated Fundamental Tab, Order/Trade Chart Display
Features Release Notes:
Smart Trade Ticket, Global Chart Settings, Updated Fundamental Tab, Order/Trade Chart Display
Announcing the latest features/functions updates, additions or edits to the trading platform:
The Smart Trade Ticket is easier to use and allows for future capability depending on what brokerages offer. One Example if this would be Conditional Orders.
Global Chart Settings have always housed where to control candlestick/volume bar colors as well as Tooltip displays. Now, clicking on the gear allows you the ability to display Annotations, Positions/Orders and Events.
The Fundamental Tab under Research has an improved, easier to read display with additional features for a clearer snapshot of a stock’s past and forecasted performance.
You’ll be able to differentiate a Conditional Order from a Staged Order as well as a Yet-To-Be-Executed-Order with the enhanced Order/Trade Display.
Smart Trade Ticket
Smart Trade Ticket
The redesigned Trade Ticket has defined sections for Stock/ETF trades and Option Trades. The Stock Ticket is divided into Open and Exit sections for easier use.
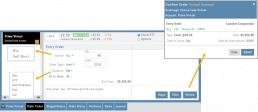
The Close Ticket provides a summary of any Profit/Loss on the trade. Brokerages determine available Order Types, which may include the following to open a trade:
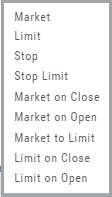
Note: Closing Order Types may also include Trailing $ and Trailing %.
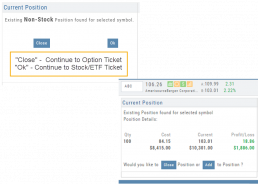
If there is an existing position on a Symbol when a new order is created, the Smart Ticket system will identify if there is an existing Non-Stock/Multi-leg Position or an existing Stock position.
If Non-Stock/Multi-leg position, clicking “Close” will navigate the user to the Option Trade Ticket. Clicking “Ok” will lead the user to the Stock/ETF Ticket.
If there is an existing Stock position, a summary of the existing will display along with the ability to Close or Add to the existing position.
Global Chart Settings
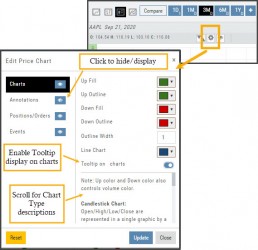
Global Chart Settings
Manage common chart settings from one location by clicking on the left-most Gear icon on the Chart Header which is located under the saved chart periodicities.
In addition to setting your Bullish/Bearish candlestick and corresponding Volume bar colors and control of whether you want Tooltips to display on the chart, you can view/hide:
All Chart Settings
Annotations
Orders/Positions
Events (Dividends/Earnings)
Simply click the ‘eye’ icon to display/hide your selection. Once finished with your Global Settings, click “Update,” then “Close.” To reset to default settings, click “Reset.”
Improved Fundamental Display
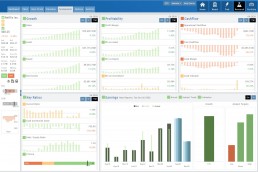
Fundamental Data has a new look
The area charts under the Research>Fundamental tab have been replaced with bar charts for easier understanding.
A Tooltip appears when you hover your cursor over the bar charts providing information for that data point.
Estimated Earnings is now in the same window as Historic Earnings for clearer comparison as both sets of data now have the same orientation
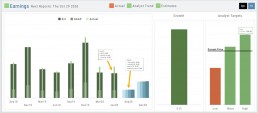
The Earnings display has been enhanced to illustrate past and projected data in the same window to match the orientation for a more accurate ‘apples to apples’ comparison.
Click on any of the legend icons to toggle the data displayed.
![]()
The Analysts’ Target Window displays the current stock price as a horizontal line for reference.
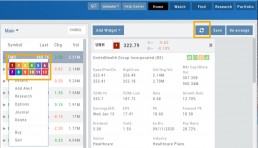
Custom Page Enhancements
The widgets with that number will automatically populate accordingly.
To change displaying one symbol to another using a Watchlist, simply click on the Action Icon of new Symbol and select the number of the current Symbol you want to replace.
A refresh icon ![]() has been added to the Header to make it easy to update the Custom Page display after rearranging widgets.
has been added to the Header to make it easy to update the Custom Page display after rearranging widgets.
We’ve increased the number of symbols that can be tagged from 6 to 12.
Using the Watchlist displayed on the left side of the screen, click the Action Icon (triangle) to left of Stock Symbol you want to display and assign a number, 1 to 12.
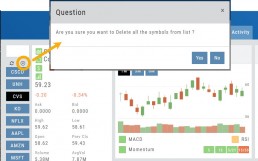
Delete Notice added to Research Tab
A Warning Notice now displays when ‘x’ is clicked on the Research Tab requiring confirmation prior to removing the list of symbols from the tab.
Change Log
- Heat Map filter setting/saving improved
- Interval call split adjustments
- Greek Summary displays on Positions tab
- ETF list on Home Page issue resolved
- Strike Arrow functionality restored on Option Chain
- Sorting Scan after scrolling behavior corrected
- Eliminated stacking Indicators on charts
- Alert list is scrollable
Alert Functionality (Premium Desktop Feature)
Alert Functionality
Alerts can greatly improve trading effectiveness by notifying you on a potential trade opportunity and help you decide when to manage, enter or exit a trade.
Set up Alert notifications based on Last Price, Volume, $ Change, % Change, or % Offset.
If you’ve logged into the platform with either Streaming Quotes or RealTime Quotes through a linked brokerage account *within the last 30 days* – Alerts will be Real Time.
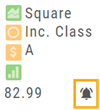
Alert Icons
- Add (+) New Alert – This icon is located on the symbol Quote Box
- Hollow Bell – Active Alert, not triggered
- Shaking Bell – Triggered alert, not yet viewed
- Solid Bell – Alert triggered today, already viewed
- Paused (z) or Used Alert – located in Alert Management Page

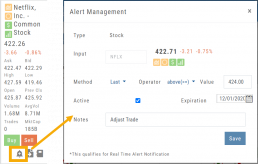
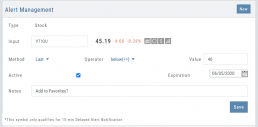
Set Your Alert
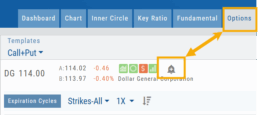
Click the Alert Icon, located on the symbol Quote Box and as shown on the Option Tab for the Chain or Strategy Template. The symbol, Score Icons, Last Price, $ and % Change automatically fill in. To complete the rest:
-
-
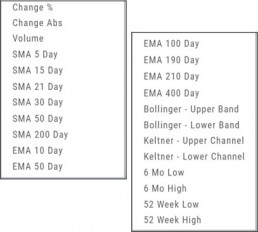
- Select Method: 23 to choose from! See list below
- Select Operator: Above/Equal To or Below/Equal To
- Enter Value: $, % or Quantity (Quantity example: 11,000,000 or 11M)
- Select Expiration: Valid up to 6 months. Click on Calendar Icon to navigate months
- Add Notes, if desired
- Click Save
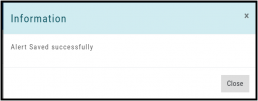
An Information notification appears: Alert Successfully Saved
-
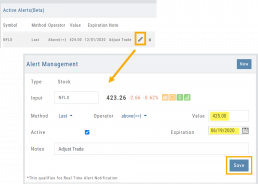
Alert Management
Manage your Alerts by going to: Research Tab>Alerts.
From this page, you can modify or remove alerts, view unread triggered alerts in one location and view prior alerts.
-
-
- Select Method: See List on right
- Select Operator: Above/Equal To or Below/Equal To
- Enter Value: $, % or Quantity (Quantity example: 11,000,000 or 11M)
- Select Expiration: Valid up to 6 months. Click on Calendar Icon to navigate months
- Add Notes, if desired
- Click Save
An Information notification appears: Alert Successfully Saved
-
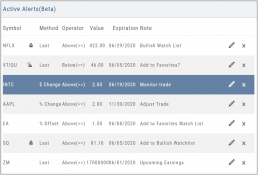
Active Alerts
This table lists all active alerts including:
Trigger notification – A bell icon appears if alert was triggered
Delayed Alert icon, if applicable
Settings – Method, Operator, Value
Expiration Date – Alerts can be active for up to 6 months
Notes
Ability to modify or remove from list
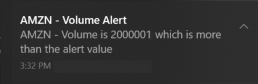
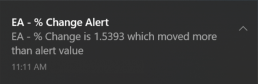
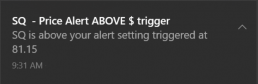
Alert Notifications
In addition to platform notifications, as long as you allow notifications, alerts can be sent to your computer or mobile device even if you are not logged into the platform.
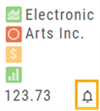
Hollow Bell
The Hollow Bell indicates this Alert is Active, but has not been Triggeredwill appear next to the symbol whether on the QuoteBox in Research or on a Watchlist .
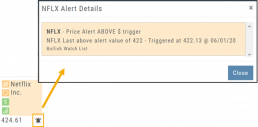
Ringing Bell
The Ringing Bell icon indicates the alert has been triggered and notification sent out. The highlighted area on the Quote Box or where it appears on a Watch List allows you to access the alert notification by clicking on the bell.
This display will show until the alert is read either from a Watch List, Quote Box or the Alert History section of the Alert Page.
Solid Bell
Once an Alert is read or “Marked As Read” on the Alert Notification page, the icon becomes a Solid Bell.
Clicking on the icon will still display the triggered alert until the next Market Day.
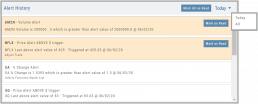
Alert History
This section displays triggered alerts for the time period selected: Today or All. The highlighted entries are Unread Notifications – the notices were not clicked on from the platform.
Click “Mark All as Read” to update entries.
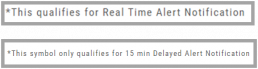
A note about Real-Time & Delayed Alerts
Note: There are two ways 15 minute Delayed Alert Notification applies with Alerts:
1. If it’s been more than 30 days since a linked brokerage account with RealTime Quotes has been logged into – OR – the platform does not have Streaming Quotes.
2. OTC stocks will show as delayed, regardless of RealTime or Streaming Quotes
One of two notices will appear for each Alert
Intraday Trade Finder Scan Updates (Premium Desktop Feature)
Trade Finder Scans are updated every 30 minutes during Market Hours on the Premium Platform. That’s 12 more times than the Standard Platform version, which updates once after the Market opens.
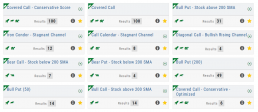
Trade Finder Scans are easily identified with a Rocket Icon in the upper left corner of the Scan box.
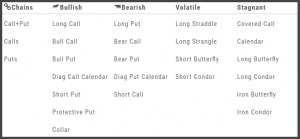
Strategy Template
A Strategy Template provides a shortcut to quickly create an option strategy, virtually eliminating structure errors. Once selected, you can modify the structure within the template using the tools on above the option tables: Moving Strikes up/down, rolling Time out/in, widening or narrowing Strikes.
![]()
Some strategies can be changed from all Calls to all Puts (and vice-versa).
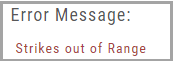
Note: The templates will not allow you to exceed certain parameters, as attempting to do so would result in an invalid strategy. This is a built-in safety net and you would receive a notice similar to:
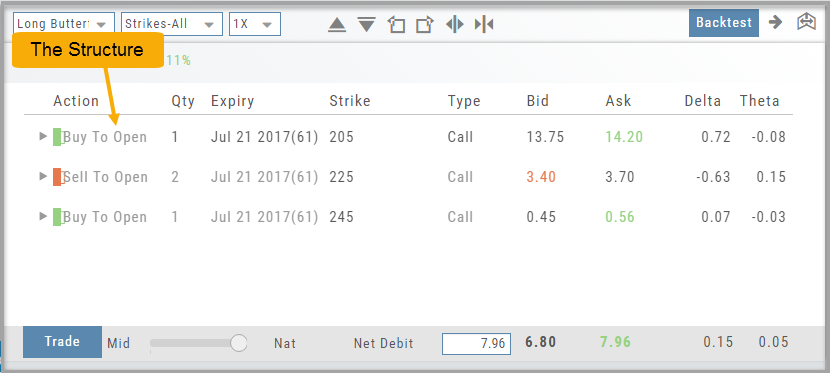
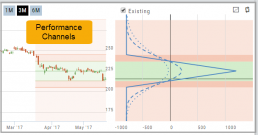
Storyboard of the Strategy
We also display a storyboard-like view of the selected strategy. It is a combination of chart, risk graph, and performance channel constructed within one panel.
This storyboard gives you the full picture of the position: The Structure, Performance Channels and Calculations.
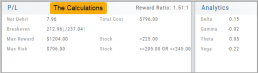
Designed to provide the level of information you want
As much information you want. When you want it.
Each of our scoring algorithms are derived from several factors, all captured in a user-friendly format.
The stock dashboard provides a more detail summary layer view of The Score. Each component: Technical, Inner Circle, Valuation and Fundamentals allows you the ability to obtain the information you want, when you want it – and kept tucked away, when you don’t.
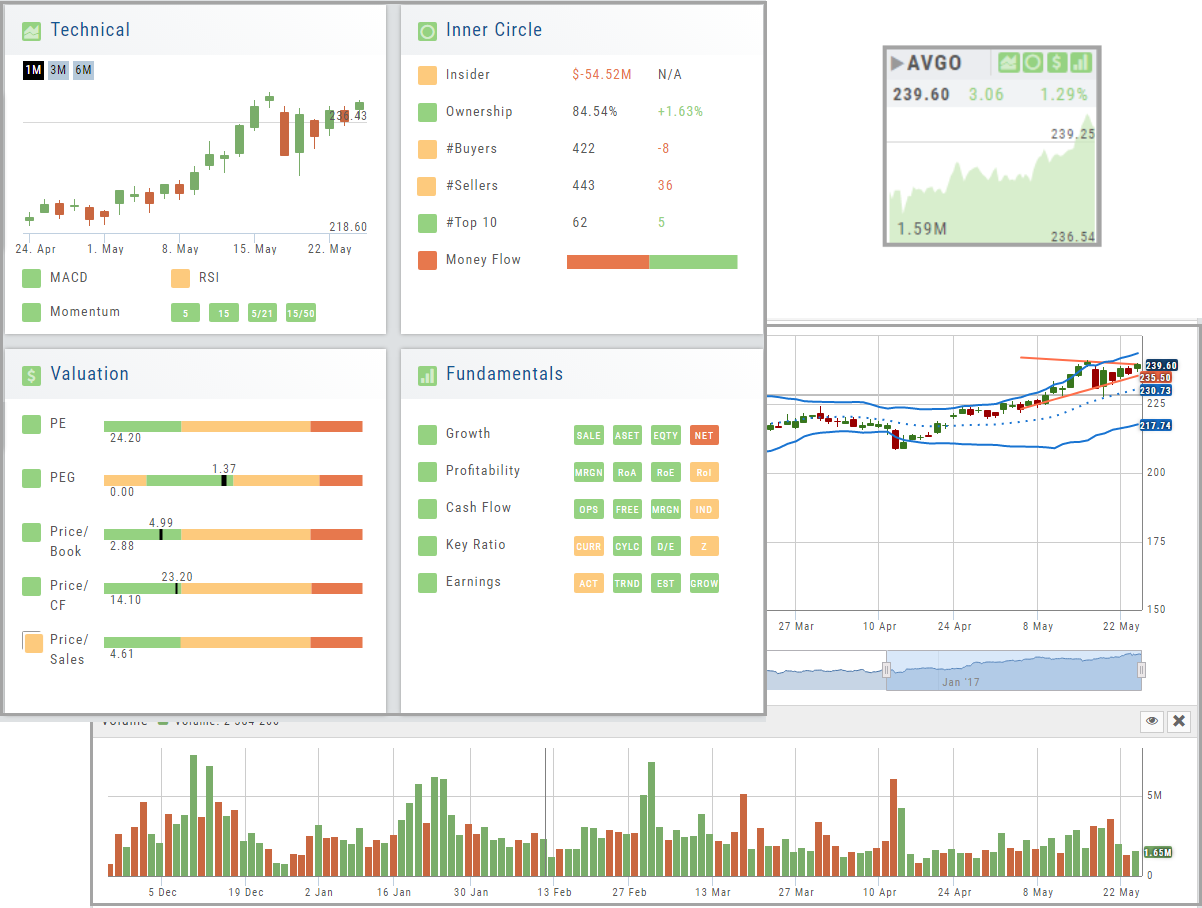
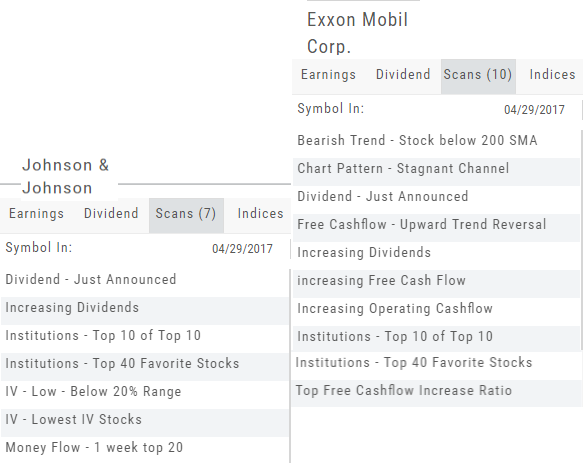
The Dashboard Scan Tab
Get the current ‘story’ on a stock.
The Scan Tab is particularly interesting. In addition to providing a list of scans the stock is currently included in, it can give you a “story” about the stock. Based on the scans that the stock is showing up in, you can get an overview of outlook on the stock.
For example: JNJ shows solid longer term positive outlook.
XOM Shows stagnant with improving longer term outlook