Platform Features Release: New Zoom Functionality, Chart Panning
Announcing the latest Release of feature and functionality additions and enhancements to the trading platform to assist the investment/trading decision process.
New Zoom Functionality
To activate Zoom, click on the Zoom button has been added to the icon toolbar:
![]()
- Once activated, the button changes color.
- Click/drag the mouse/cursor over the area of study.
- A “Reset Zoom” button will display when you want to restore the view.

Chart Panning Functionality
Click/drag now pans the time period/price range on the chart – when dragging your mouse/cursor either right/left
Other Additions
- “Choppiness Index” Chart Lower Indictor added
- “Are You Sure You Want To Cancel This Order?” added on Order Status tab
- Clicking on “Quotes By” box (lower right corner) will display source of quotes
Change Log
- Reuse .XSP and .SPX order functionality restored
- Trading Block OTM trade error fixed
- Schwab recognizes BRK.B now
- Resolved Liquidity Range in Screener
Platform Features Release: New Zoom Functionality, Chart Panning
Announcing the latest Release of feature and functionality additions and enhancements to the trading platform to assist the investment/trading decision process.
New Zoom Functionality
To activate Zoom, click on the Zoom button has been added to the icon toolbar:
![]()
- Once activated, the button changes color.
- Click/drag the mouse/cursor over the area of study.
- A “Reset Zoom” button will display when you want to restore the view.

Chart Panning Functionality
Click/drag now pans the time period/price range on the chart – when dragging your mouse/cursor either right/left
Other Additions
- “Choppiness Index” Chart Lower Indictor added
- “Are You Sure You Want To Cancel This Order?” added on Order Status tab
- Clicking on “Quotes By” box (lower right corner) will display source of quotes
Change Log
- Reuse .XSP and .SPX order functionality restored
- Trading Block OTM trade error fixed
- Schwab recognizes BRK.B now
- Resolved Liquidity Range in Screener
Platform Features Release: Trade from the Chart, Price Slices, Reset Virtual Account Options
Announcing the latest Release of feature and functionality enhancements to the trading platform to improve the position evaluation process, trade submitting process as well as offer additional practice account settings:
Price Slices: Evaluate theoretical outcomes of option positions when using the Strategy Templates.
Trade from the Chart: Use the control box or lines on Chart to adjust the entry point, Target Price and/or Stop Price.
Reset Virtual Account – Add ‘funds’ to an existing account OR reset everything and start fresh. You decide.
Price Slices (Premium Feature)
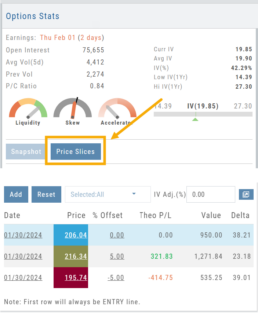
The ![]() Button appears on the right side of the screen when using the Strategy Templates.
Button appears on the right side of the screen when using the Strategy Templates.
Select one of the 22 Option Strategy Templates.
Build the position.
Click the Price Slices button to start your evaluation
Change the Date (default ‘today’), Price levels and/or % Offset
Add IV to view how this affects the theoretical P/L
Click the Go Big icon to view additional Greek data
Trade from the Chart
The ![]() button appears at the top of the chart for any symbol – whether there is an existing position or not.
button appears at the top of the chart for any symbol – whether there is an existing position or not.
Clicking this button activates an Order Window on the Chart, like this:
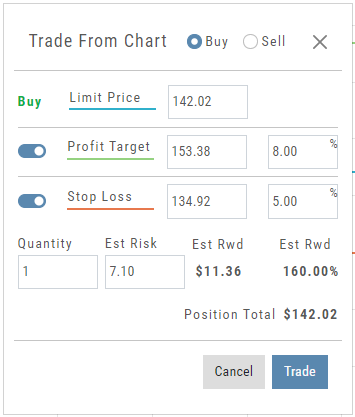
Note: Buy, Profit and Stop Loss line colors will match those displayed on the chart itself.
The values in the Order Window can be manually adjusted by $ or %
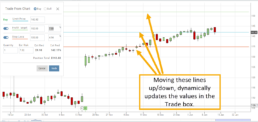
The values can also be dynamically adjusted by moving the corresponding line(s) on the Chart itself.
The Quantity value default is “1” to show the ‘per share’ dollar and percentage estimated risk, reward, as well as Position Total.
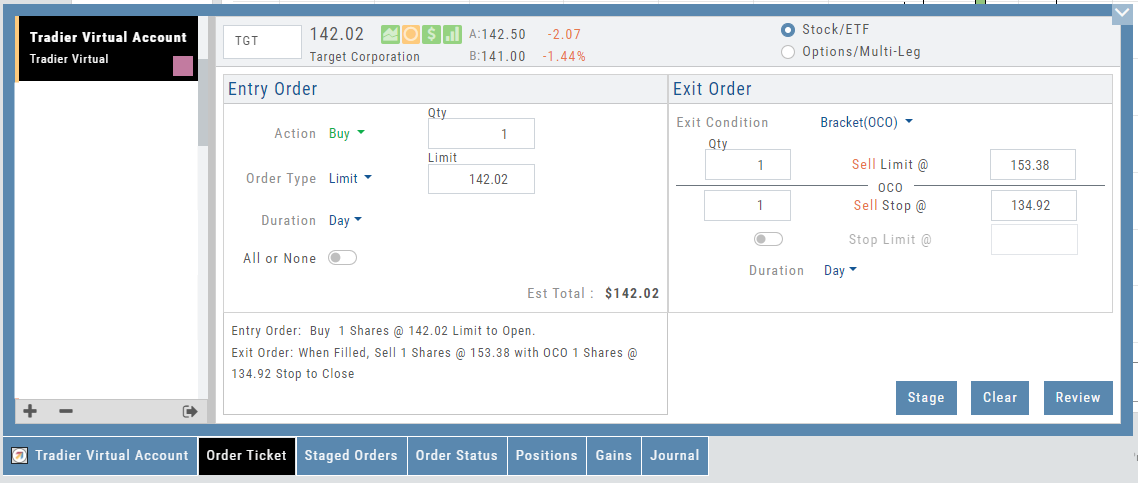
Click “Trade” for the prefilled Order Ticket to display.
The Order Ticket can be further adjusted, Staged or Reviewed to ensure it’s completed to your satisfaction, then Submitted.
Note: The brokerage selected must support Bracket Orders if the Stop/Stop Limit values are selected on the Order Window
Reset Tradier Virtual Account – 2 options
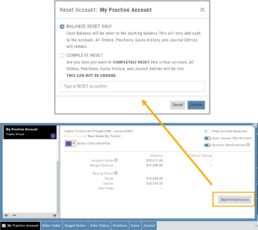
Tradier’s Virtual Account gives you the ability to add more “Cash” to your practice account – OR – completely start over:
On the account summary page, click “Reset Virtual Account”
Select “Balance Reset Only” – to keep your existing trade activity, but add more “cash” to your virtual account.
Select “Complete Reset” – if you want to remove all prior transactions, including Journal Entries, Gains, Orders, Positions, etc. Note: This selection cannot be undone once it’s processed.
Type RESET in the box provided, then click the “Confirm” button
Enhancements
- ATM Option Strikes are bolded for easier identification
Change Log
- Adjusted theme contrast
- Corrected Order Type Limit price entry
- Snapshot functionality restored
Designed to provide the level of information you want
As much information you want. When you want it.
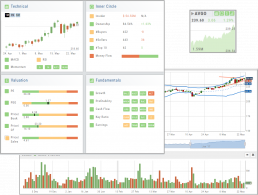
Each of our scoring algorithms are derived from several factors, all captured in a user-friendly format.
The stock dashboard provides a more detail summary layer view of The Score. Each component: Technical, Inner Circle, Valuation and Fundamentals allows you the ability to obtain the information you want, when you want it – and kept tucked away, when you don’t.
The Dashboard Scan Tab
Get the current ‘story’ on a stock.
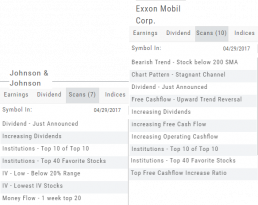
The Scan Tab is particularly interesting. In addition to providing a list of scans the stock is currently included in, it can give you a “story” about the stock. Based on the scans that the stock is showing up in, you can get an overview of outlook on the stock.
For example: JNJ shows solid longer term positive outlook.
XOM Shows stagnant with improving longer term outlook
Earnings, Dividends and more...
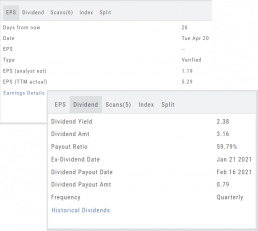
The far right, lower box in Research provides the following:
Earnings Tab: Get Earnings date, number of business days until announcement, Estimated and Actual Trailing Twelve Months (TTM) EPS, and link to the prior 12 Quarter Earnings details.
Dividend Tab: Get Yield, Amount, Payout Ratio (dividend/EPS), the Ex-Dividend Date (deadline to complete a stock purchase to be entitled to dividends), Payout information, Frequency and link to the prior 12 Quarter Dividends.
Scans Tab: Quickly view how many & which scans the stock symbol appears on.
Index Tab: Lists the symbol and indices name(s) on which this stock appears.
Split Date: Provides most recent Split Date, Detail and a link to view Split History
Overview & News
Located in ‘The Dashboard’, the Overview provides a snapshot of the company, including the Sector and Industry. By clicking on the Industry link, a list of stock symbols in the same category will appear. The “Stock Detail” list will have current market information and The Score navigational icons.
The News section lists articles covering, related to, or mentioning the selected Company. Click on any headline to be linked to the full article.

