Export Reports (Desktop)
Clicking on ![]() located on the upper left corner of the Positions and Gains tabs allows you to export that information as a .csv file.
located on the upper left corner of the Positions and Gains tabs allows you to export that information as a .csv file.
The Journal give you the ability to export reports in a PDF file on your desktop platform. But that’s just the beginning.
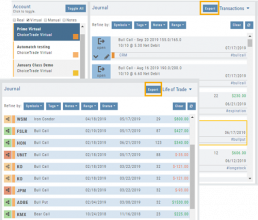
You can export from the Transaction or Reconciliation view filtered by Account, Symbol, Tags, Notes and/or Date Range.
Life of Trade View also allows you to filter by Order Status in addition to the above criteria for even more focused report. Only want to print Closed Trades? Want to see how many trades are Unmatched? Select those filters.
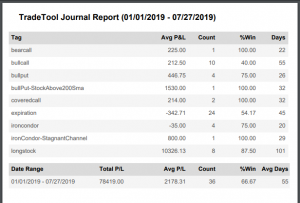
The top of your Journal report displays the Tag Summary based upon the account(s) and filtering criteria selected.
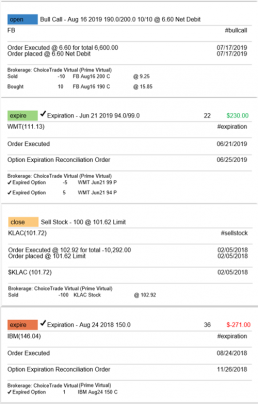
The trade detail report displays the status, Open, Close, Expire with a color code of the trade: Blue=Open, Green=Profit, Red=Loss, Yellow=Unmatched.
Tag Results-Table Summary Totals
Located below the Analytics Tab in the Journal, the Tag Result Table Summary displays trade performance by Date Range, Total P/L, Average P/L, Number of Trades (Count), % Profitable and Average Number of Days in Trades.

This data is dynamically updated by available filters including:
Type of account(s) (Manual, Virtual &/or Live)
Specific trading account(s)
Date Range
Stock symbol
Tags

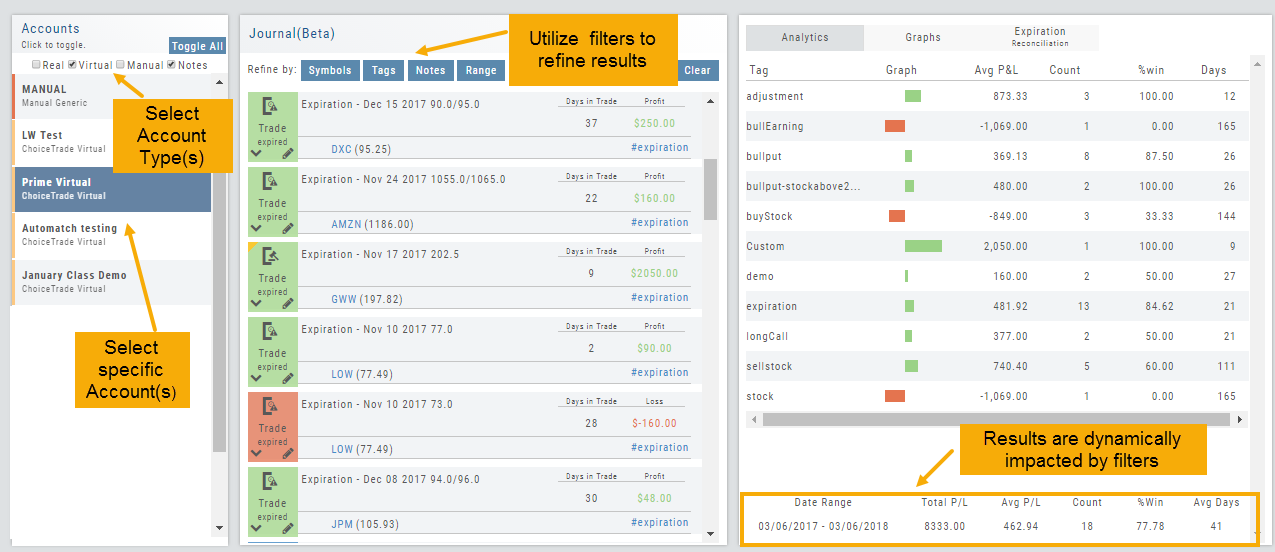
Not only does this table provide valuable information, you can use it to compare strategies, track improvement in your overall trading, etc.
Insight Tab in Journal
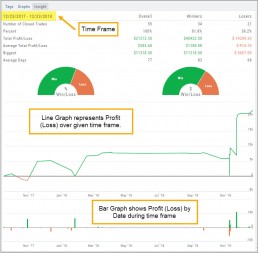
The Insight Tab, along with Tags and Graphs update dynamically with the account(s), symbol(s), tag(s) and/or date range selected.
Insight breaks down Overall Performance by Winning and Losing trades in addition to:
- Number of closed trades
- Percent (Winning/Losing Trades)
- Total $ Profit/Loss
- Average Total Profit/Loss
- Biggest (Winning/Losing Trade)
- Average Days in Trade
P/L & Duration/Timeline Graphs
Journal Trade Graphs
This tab offers two views of your Closed, Matched or Reconciled trades: P/L by Trade Duration and P/L by Timeline. The views update dynamically by Account, Symbols, Date Range and #tags.
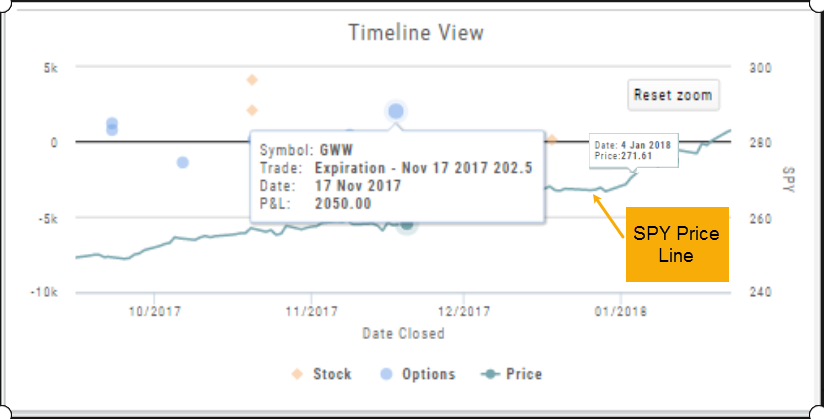
The Timeline Graph.
Click/Drag your cursor to adjust/enlarge the orientation view.
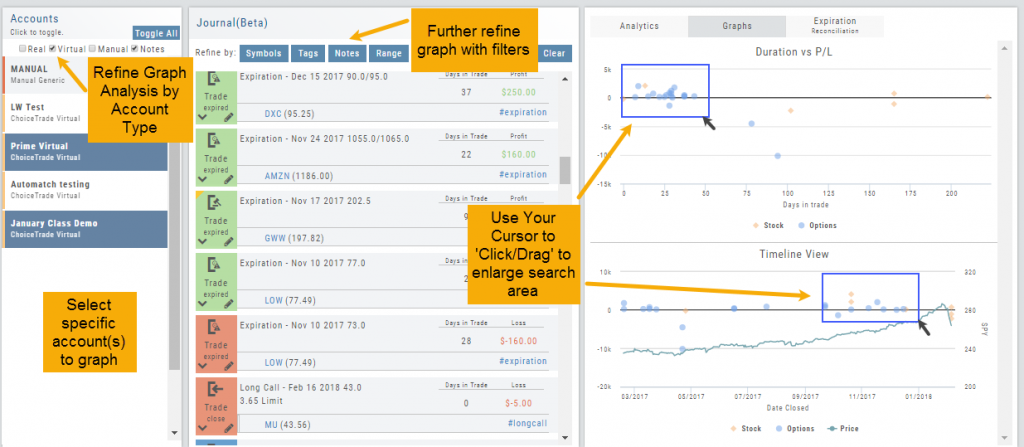
Hover your cursor over each graph plot for trade detail. Circles = Option Trades, Diamonds = Stock Trades. The Duration View shows P/L and # of Days in the Trade
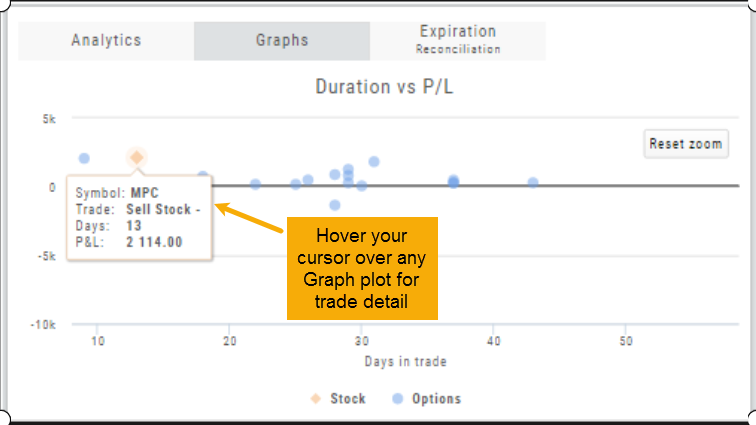
Timeline View displays P/L on Date Closed or Expiration
SPY Price is displayed on the Timeline View. Slide your cursor along this graph line to show end-of-day price for that date.
