Platform Features Release: March 2023
Announcing the latest features/functions updates, additions, or edits to the trading platform:
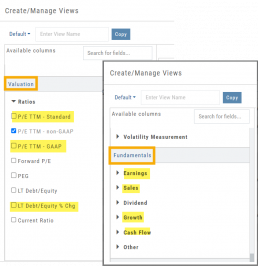
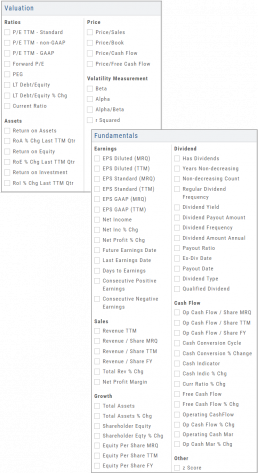
Valuation and Fundamental Data Points added
Users have more criteria to select from for both the Screener, to find potential trade candidates, and Watchlist Views to analyze candidates.
Valuation and Fundamental Data Points Added
Watch List Views
Over 30 data points were added to the Valuation and Fundamental sections for Watch List Views.
Build, Save, and Edit your customized Watch List Views to your needs.
Learn how to use this feature:
Screener
Over 30 data points have been added to the Screener Function under the Valuation and Fundamental sections.
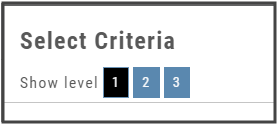
There are 3 Levels of Data Points. Level 2 has more Data Points than 1, Level 3 has all criteria available to select from.
Now users have more tools to choose customize screens. These may be saved and edited at any time.
Enhancements
- Added Average Volume line to (upper) Volume Indicator
- Saving Annotations/Texts, etc on charts are an automatic function. It no longer has to be selected.
- Scroll function added to lists on Custom, Market and Watch pages
- GAAP/non-GAAP PE/PEG (TPE and PE chart in Valuation section to reflect GAAP PE)
Change Log
- Resolved Screener Export Function
- Open/Close “save” function fixed in Backtest mode
- 2nd email saving in Notification feature setup
- Candlesticks and Volume bars line up
Create Watchlists from Spectrum View
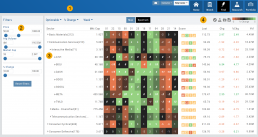
Spectrum View can be used to create or add Watchlists
1. Select the Group, Operator and Time Period
Example: Optionable, % Change, 1 Week
2. Apply Filter for Price, Volume, Market Cap and the Selected Operator
3. Click the Arrow next to the Sector to expand to Industry, repeat to display list of stocks that fits the filtered criteria.
4. Use the Icon Toolbar to multi/select symbols to either send to an existing Watchlist or Create a New List.
Use the same filters on the HeatMap View to customize your search.
The box size denotes the Market Cap size.
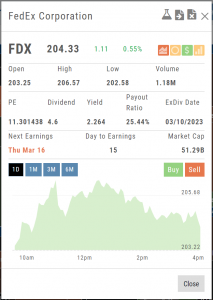
Click on the individual box to view:
Market Activity
Earning/Dividend info,
View Chart Periods
Buy/Sell stock
Send to Research
Add to an Existing Watchlist.
Platform Features Release: August 2022
Announcing the latest Release of feature and functionality enhancements to the trading platform. These allow for more customizing ability and streamlines functions on accessing or displaying information. Highlights include:
Screen for Weekly Options – The ability to screen for weekly options has been added to the Screen Function under Find.
Rearrange Screener Data Points – Change selection order directly on the Results page, by drag/drop action.
Large Chart Widget on Custom Page –The new widget fits an entire row on the custom page.
Customize Moving Averages – The Moving Average thickness can now be customized.
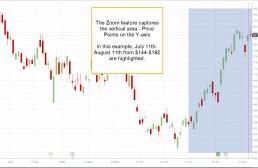
Vertical Zoom on Chart – Function expanding to allow for Horizontal and Vertical Zoom.
Double-click function on Expiration Cycle Page –Eliminates need to click “Okay” button
Screen for Weekly Options
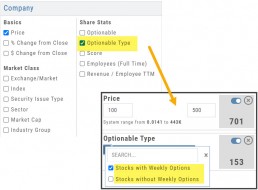
The Screener – located under the Find Tab – now provides the ability to screen for Weekly Options.
Now customizing your own searches is even better!
Remember, you can save Screens for future use – and even edit/update them as needed.
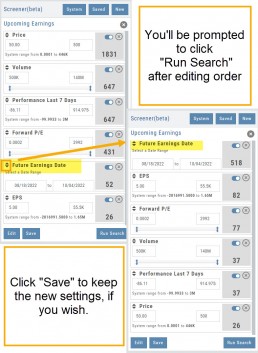
Rearrange Screener Criteria
Rearrange Screener data points on the Results page by clicking ![]() located on the upper left corner of each data point, then drag up/down.
located on the upper left corner of each data point, then drag up/down.
The data points are filtered with each entry in the order they are listed.
Additional edits can be made with the existing Screener data points:
Click ![]() to keep the data point but disregard in an updated “Run Search”.
to keep the data point but disregard in an updated “Run Search”.
Click ![]() to remove the data point from an updated “Run Search”.
to remove the data point from an updated “Run Search”.
Save to keep the edited Screener for future use.
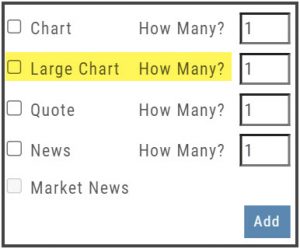
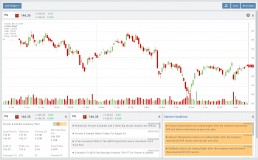
Large Chart Widget on My Custom Page
An individual chart can be set on an entire row on the Custom Page by selecting the Large Chart widget.
The Custom Page set-up and arrangement remain the same.
Customize Moving Average Lines
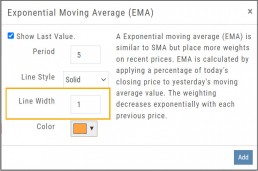
All Moving Average Indicators, Exponential, Simple, Triangular and Weighted can be customized to set Line Width. The default setting is ‘1’.
This update, along with previously added, user-defined “Line Type” allows for even more identification in charting analysis.
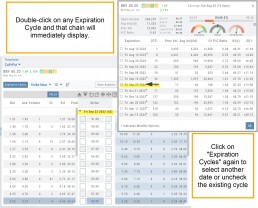
Expiration Cycle Double-click Functionality
Quickly access one or more Expiration Cycles by double-clicking on each row you wish to evaluate.
The selected dates will automatically display on the Chain.
Click “Expiration Cycles” button again to revise/add to existing cycles.
Vertical & Horizontal Zoom Functionality
Change Log
- Corrected “Extend By” behavior on Chart with Streaming
- Created ability to reconcile partial trades
- Updated Annotation editing capability when adding text
- Resolved Edge browser/Annotations conflict
- Volatility Stop Indicator – expanded
- Fixed navigation break: Chain>Chart>Chain
- Analyze function restored on certain strategies
- Alert tool-tip correction
- Adjusting Parallel lines now saving
- Corrected Pending/Executed Order on Chart display
Platform Feature Release: Screener
Feature Release Notes: Screener
Announcing the latest feature/function updates, additions or edits to the trading platform:
Screener – Trading styles are unique. Screener, the platform’s newest feature allows for customized opportunity searches. Differing from Scans, which are predefined, Screener offers over 120 data points for customize searches based on what the user’s goals are. Additional data points will be forthcoming.
Screener searches may be saved and named for the user’s future use. In addition, System Screeners are available as starting point templates for the user to customize and save as personal Screeners.
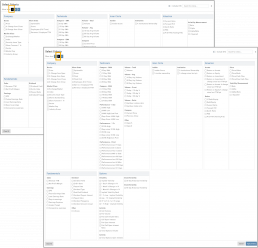
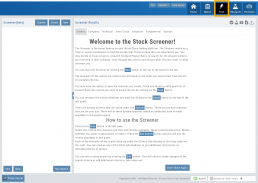
Screener
Located under the Find Tab, the Advanced Screener is designed to allow the user to customize their own trade candidate searches. Over 125 criteria selections are available – with more to follow.
Screener is flexible – allowing you to create save as many Screen searches as you wish, edit as needed, even download results.
Screens are user-defined, 100% customized by the user’s specifications. They can be edited, saved and deleted.
Left Control Panel
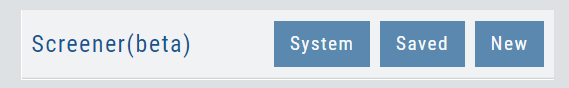
New – Create a new screener
Saved – Previously created and saved screens. Saved screens can be edited for a single-use or saved as a new screen or overwriting the previously saved screen
System – Templates available for use as starting points for new screeners. While the System screens themselves cannot be modified, they can be used as a foundation for newly created screens that – can be modified for personal use and saved.
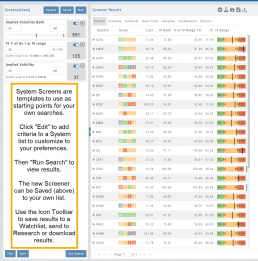
Select your Criteria
There are 3 Levels of Data. Currently Level 3 mirrors Level 2 – as more criteria will be added to this feature.
Level 1 offers Basic Information to select from. Level 2 expands upon what Level 1 offers.
After choosing your criteria, you’ll be able to set the parameters for each criteria selection on the next screen.
Click “Run Search”
Note: The order the criteria is selected, will be the order the selections are displayed on the next screen.
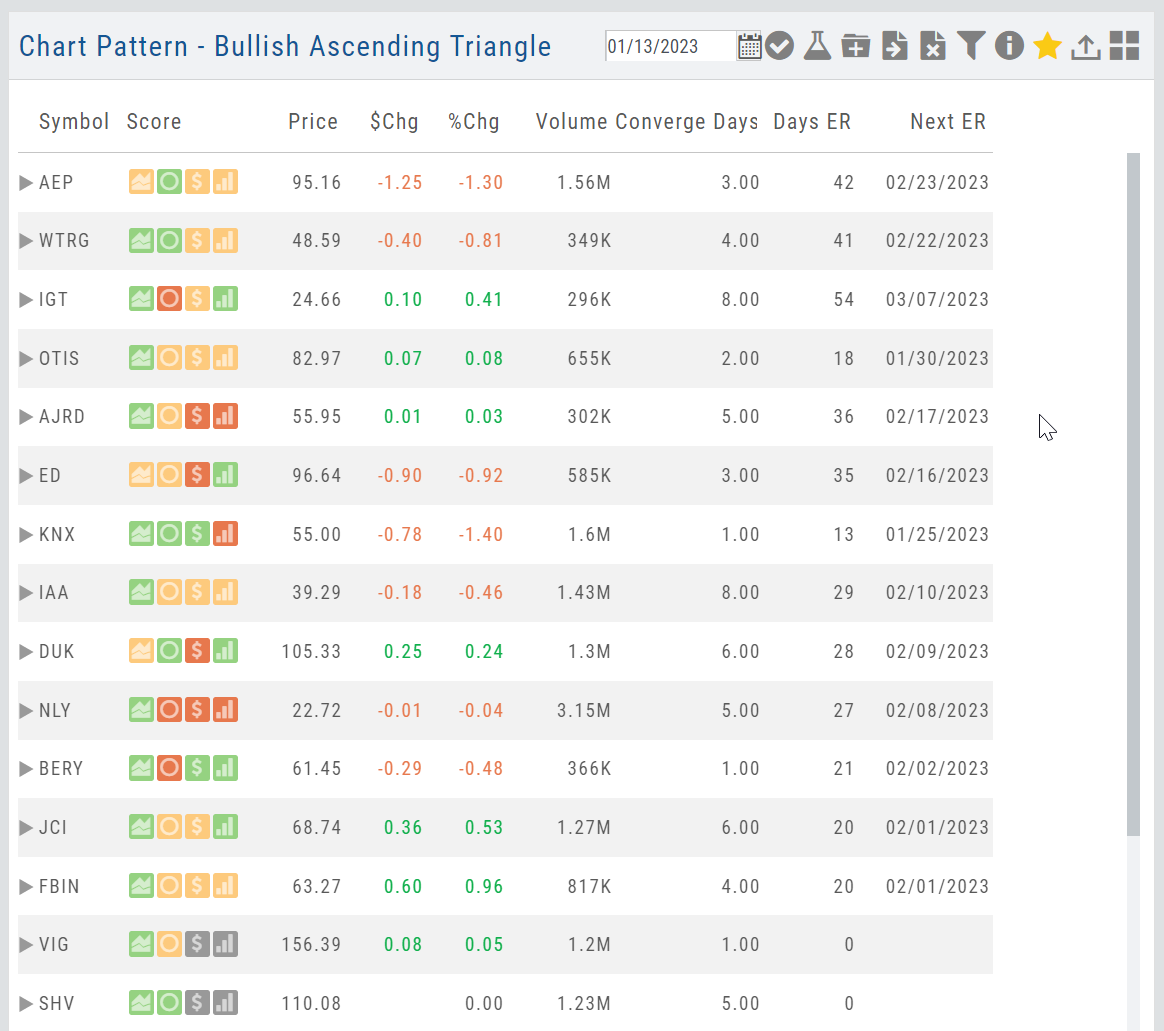
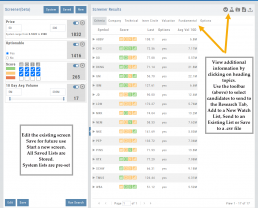
The Results
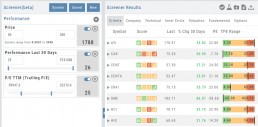
The criteria selected in this example were Price ($50-200), Optionable, Score (Green or Yellow for each Icon) and 10-day Average Volume (5M-293M) resulting in 17 candidates.
From here, using the Icon Toolbar, candidates can be selected and:
- Sent to Research for further analysis
- Sent to an existing Watch List
- Used to create a New list
- Can be download to a .csv file.
The Screen itself can be Saved (and named), further modified -either by
adjusting the existing criteria or adding new datapoints – or a New Screen
can be created.
Additional data is accessible by clicking on “Company”, “Technical”, etc
above the list of candidates.
System Screens are also available and new ones will be added.
The user can customize such screens and save to the platform just as any other
screen.
Candidates can be sent to Research, to a Watch List and/or
downloaded to a .csv file.
System Screens themselves cannot be modified and are designed to be
‘launching points’ for the user’s convenience if they wish to use them.
Note the colored bar graph of IV Range. It provides a ‘picture’ of where this
Stock/ETF is now for this datapoint.
Change Log
- TTM Squeeze Indicator added
- Option Chain column line up
- Double scroll bars appearing in Safari/Screener
- Split notification on Chart added
- Staged Order behavior -data loading resolved
- Trade Button appearance on Chart from Staged
- Industry Link responsive
- Mobile – corrected Stage Button function on Stock Order Ticket
- Mobile – updated “Save” Alert functionality
- Mobile – adding Indicator (Android) corrected
- Earnings < 7 days are noted in red
Screener (Premium Desktop Feature)
Screener
Located under the Find Tab, the Advanced Screener is designed to allow the user to customize their own trade candidate searches. Several hundred data points are available to select from, build your Screen, Save for future use and Edit as needed.
Screener is flexible – allowing you to create save as many Screen searches as you wish, edit as needed, even download results.
Screens are user-defined, and 100% customized to the user’s specifications. They can be edited, saved, and deleted.
Left Control Panel
New – Create a new screener
Saved – Previously created and saved screens. Saved screens can be edited for single use, saved as a new screen, or to overwrite the previously saved screen
System – Templates available for use as starting points for new screeners. While the System screens themselves cannot be modified, they can be used as a foundation for newly created screens that can be modified for personal use and saved.
Select your criteria
There are 3 Levels of Data.
Level 1 offers Basic Information to select from. Level 2 expands upon what Level 1 offers. Level 3 offers all available, in-depth selections.
After choosing your criteria, you’ll be able to set the parameters for each criteria selection on the next screen.
Click “Run Search”
Note: The order the criteria are selected, will be the order the selections are displayed on the next screen.
The Results
The criteria selected in this example were Price ($50-200), Optionable, Score (Green or Yellow for each Icon), and 10-day Average Volume (5M-293M) resulting in 17 candidates.
From here, using the Icon Toolbar, candidates can be selected and:
- Sent to Research for further analysis
- Sent to an existing Watch List
- Used to create a New list
- Can be downloaded to a .csv file.
The Screen itself can be Saved (and named), or further modified – either by
adjusting the existing criteria or adding new data points – or a New Screen
can be created.
Additional data is accessible by clicking on “Company”, “Technical”, etc
above the list of candidates.
Icon Tool Bar – Hover Cursor over Icon to view function
Select one or more symbols
Send selections to Research
Create a New Watchlist with Selected Candidates
Send Candidate to an Existing Watchlist
Download to .csv file
System Screens are also available and new ones will be added.
The user can customize such screens and save to the platform just as any other
screen.
Candidates can be sent to Research, to a Watch List and/or
downloaded to a .csv file.
System Screens themselves cannot be modified and are designed to be
‘launching points’ for the user’s convenience if they wish to use them.
Note the colored bar graph of IV Range. It provides a ‘picture’ of where this
Stock/ETF is now for this datapoint.
Edit Screeners
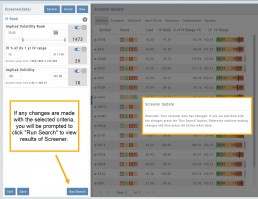
Edit current, Saved or System Screeners by adjusting parameters of existing criteria using the slide bars, entering values in boxes, etc.
A Screener Update notice will appear prompting you to select “Run Search” after adjustments are completed. Updated results will populate the left table.
From here, use the Icon Toolbar for further options: Select, Add to Watchlist, Research or Download.
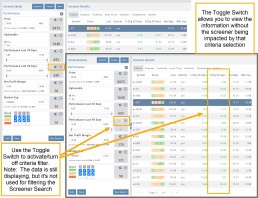
Toggle Criteria
The Toggle feature gives you additional flexibility in your Screener searches.
The ON position includes the selected criteria in calculating results.
The OFF position for that criteria will not affect the results when used to filter results. However, that data column will still be displayed with the other points selected.
Intraday Trade Finder Scan Updates (Premium Desktop Feature)
Trade Finder Scans are updated every 30 minutes during Market Hours on the Premium Platform. That’s 12 more times than the Standard Platform version, which updates once after the Market opens.
Trade Finder Scans are easily identified with a Rocket Icon in the upper left corner of the Scan box.
Scans - Find Opportunities - Overview
Stagnant? Uncertain? Bearish or Bullish? Short or long term? No problem!
This “Find” category is where to find opportunities based on current Market activity and outlook, or select opportunities based on events, such as Earnings or Dividend announcements.
Whether looking for opportunities based on The Score, Events, Chart Patterns, Bullish, Bearish, Stagnant or Unknown outlook, a scan will help you find potential trade opportunities. 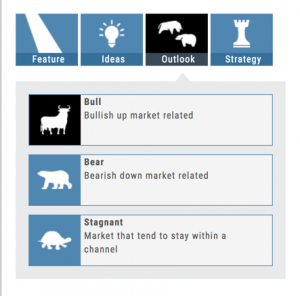
You can drill-down for scans by Category, Sub-Categories, then Group.
Example: Strategy>Time Spreads>Call Calendar Spreads. You can use the drop-down box, above the Category boxes to search for the scan you want or type in the box a generality about the scan. Examples: “Earning”, “Bull”, “Bearish”. “Score”, “Red”, “Green” will yield scans with that particular name in the scan
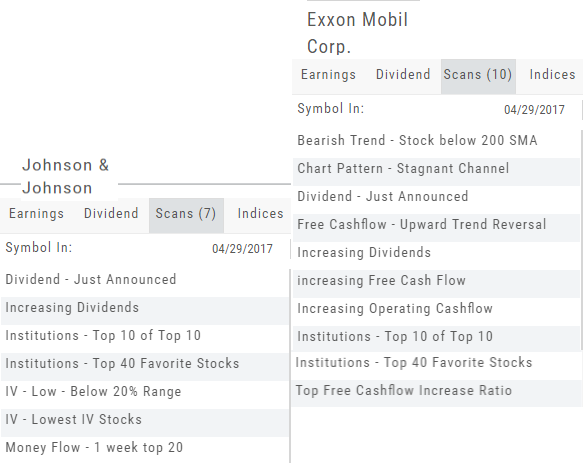
The Dashboard Scan Tab
Get the current ‘story’ on a stock.
The Scan Tab is particularly interesting. In addition to providing a list of scans the stock is currently included in, it can give you a “story” about the stock. Based on the scans that the stock is showing up in, you can get an overview of outlook on the stock.
For example: JNJ shows solid longer term positive outlook.
XOM Shows stagnant with improving longer term outlook
The Top 4 Categories
The names may be different, but the scans remain the same! 
Feature – Your favorite and our highlighted scans, including scans related to The Score.
Ideas – Scans for general ideas including Dividends, Money Flow, Volatility, Earnings and more.
Outlook – For Bearish, Bullish and Stagnant outlook conditions.
Strategy – Over 20 strategy-specific scans including Bull Put, Bear Call, Iron Condor and more.
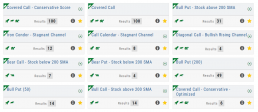
The Tile
The Scan Name and number of results are displayed on each Tile. Click on the ![]() on the upper right corner of the screen to display Scan Criteria.
on the upper right corner of the screen to display Scan Criteria.
Click on the name of the Scan Header to view results.
Use the toolbar icons on the results page to Research, send to a Watchlist, Filter, etc.