Set Up Trade & Journal Sharing (Premium Desktop Feature)
Trade and Journal Sharing
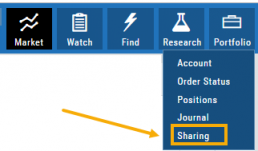
Step 1:
Select “Sharing” under the Portfolio Tab to to access these features of sharing trade ideas with peers or trading groups or have access to an Instructor’s Trades or Journal History.
Trade Sharing allows for potential trades to display in “Order Staging” listing the Source of the Order.
Journal Sharing can be used to follow a Trading Group, Instructors, Peer, Public Accounts as well as Newsletters/Trading Room applications.
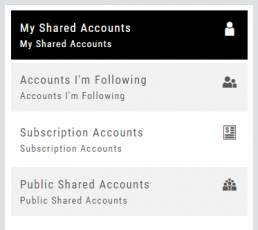
Step 2: On the left-hand panel, click on “My Shared Accounts”
Shared Accounts are grouped into 4 categories:
- My Shared Accounts – Elect to share Order Staging and/or Journal Sharing
- Accounts I’m Following – Other peers, trading partners, instructors
- Subscription Accounts – Newsletter or Trading Group applications
- Public Shared Accounts – allows access to a Public Directory with performance metrics
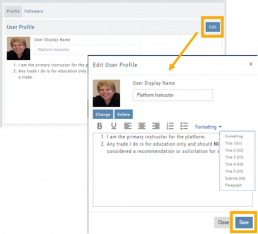
Step 3: Set up your User Profile
Click “Edit“
Add a User Display Name
Provide a Bio and/or Information about the account. This is what others will see.
The Formatting option allows you to customize the Bio/Information box.
Click “Save“
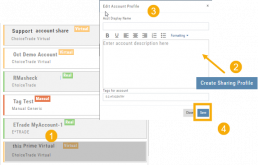
Step 4: Set Up Account Profile
1. In the middle panel, click on the Account to be shared
2. On the bottom right panel of the page, click on “Create Sharing Profile“
3. On the pop-up window, add an Account Display Name and Account Description.
Note: Both are required.
You are also able to add #tags to this Account Profile.
4. Click “Save“
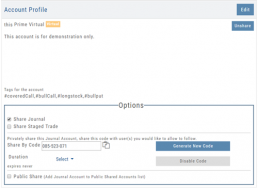
Available buttons allow you to Generate New Code and Disable Code.
Account Options
Once Shared, you can “Unshare” account by clicking on button located in the upper right of this box.
Share Journal is checked by default.
Check box for Share Staged Trades if you wish to provide that on the selected account.
A code is automatically generated to Privately Share/Peer-to-peer share
Duration drop-down menu allows you to set how long the code is valid:
Single use only
Hour
Day
Week
Until Disabled
Brokerage Access
Trade directly with select Brokers.
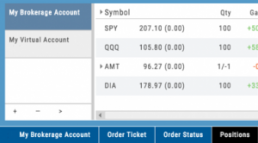
The Broker menu is located in the lower left corner of the screen and is always accessible. From here you can see your balance, positions, and orders.
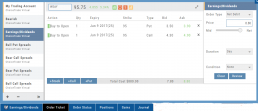
There is also an integrated Order Ticket. This can be accessed directly or from any of the “Buy”, “Sell” or “Trade” buttons or from clicking on the Action Icon menu.

Adding an Account
Accessing a live account is easy. Currently Choice Trade, Tradier, Schwab, E*TRADE are offered through this platform. More brokerages will be added.
To add an Existing Brokerage Account or add a Virtual or Manual Account:
1. Clicking on the “+” icon will display the screen below
2. Select your Brokerage, Virtual or Manual Account from the drop-down
3. Read & Accept Terms and Conditions
4. Click “Continue”
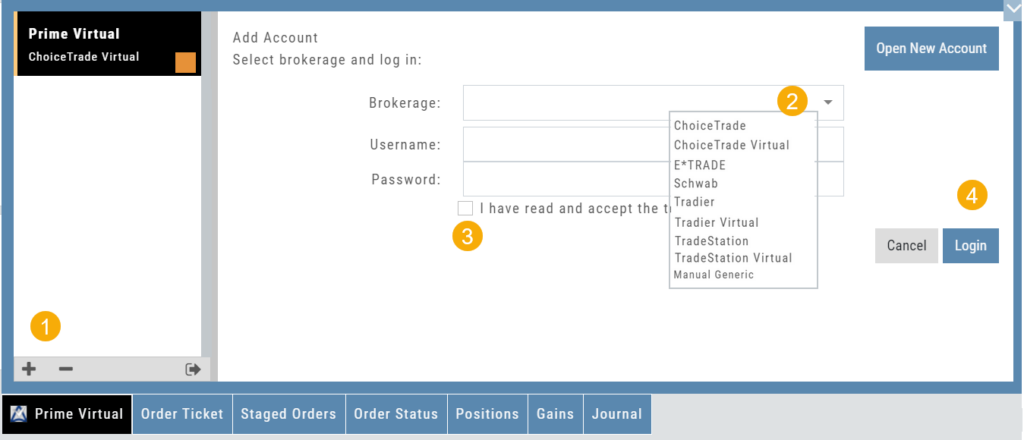
Live Accounts will prompt you to enter your credentials on the next screen.
Virtual** and Manual Accounts will automatically activate.
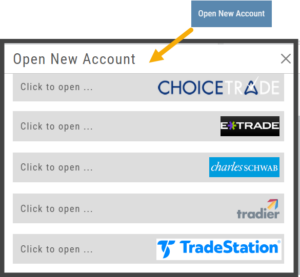 To add a New Live Account, click on the “Open New Account” box on upper right of the above screen.
Select the account you want to add by clicking the selected brokerage.
Click the “Done” button.
You’ll be directed to the brokerage website to guide you through the process of completing an application.
**TradeStation requires a completed account application to create a Virtual Account.
Manual Account Overview
A Manual Account is versatile resource tool which can enhance your trading effectiveness. You can also use this to track trades from an outside brokerage account.
Use the Manual Account for educational purposes.
- It offers flexibility and control, while providing the Analytics and Journal to help you reinforce the “Learning to Earning” process. This allows you to focus on learning the strategies.
- Place trades any time of day or night – all get immediately executed at the price entered. No need for the market to be open.
- No Buying Power limits – no expensive spread margin requirements to adhere to, no limit on how much you can buy/sell
- Place trades in the past.
- Enter trades from Backtest Mode
Use to tracking external accounts
- Can be used to track trades placed at brokers not integrated into the platform
- You can enter the date and fill prices of your actual trades
- This enables portfolio management along with your other accounts
- You can use full Journal function for tracking your progress
Manual Accounts are identified by a narrow Red Bar and are, by default, Auto-Journaled.
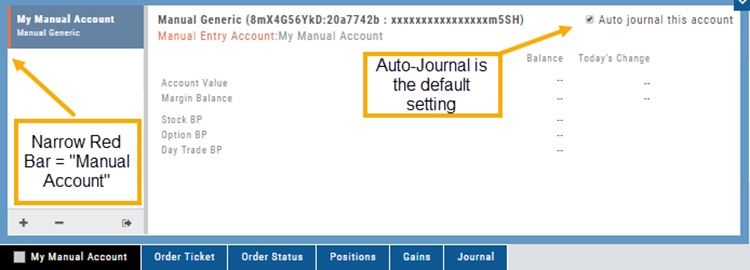
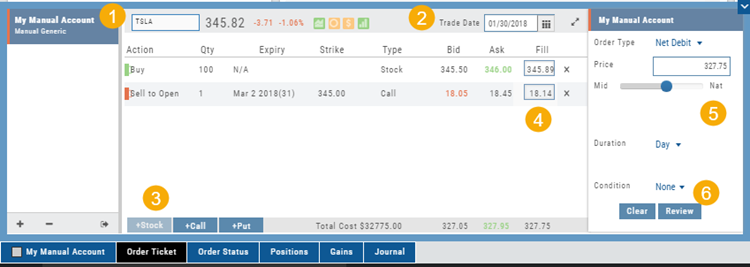
Entering trades in a Manual Account takes only a few steps and is similar to a regular trade.
You can also bring up the ticket from any trade point. Simply start a trade and select the manual account just like you would select any other account.
(Bold indicates unique to Manual ticket):
1. Enter the Stock Symbol, or name of Company (Smart search will display potential matches)
2. If this is a past trade, use the calendar/date picker to select date
3. Click “Stock”, “Call” or “Put” to build trade, change quantity, Expiry and Strike (if applicable)
4. Bid/Ask will automatically populate if a specific price is not entered
5. Complete Order Type, Duration and Condition
6. Click “Review” to confirm information is correct, then ‘Submit” on next screen.
The order will appear in Order Status as “Executed” and operate the same way as other accounts.
Virtual Account Overview
Virtual Trading gives you the real trading experience without risking any money. It is a valuable “next step” learning tool – designed to mimic the trading experience as closely as possible.
Trades are executed during Market hours – 9:30 a.m. – 4 p.m. Eastern Time, however there is a 15 minute delay after Market open for orders to begin executing.
As with Live Accounts, there are limits on trades if there is not sufficient Buying Power in your Virtual Account. There can be expensive Spread/Margin Requirements to adhere to.
Virtual Accounts do have limitations that Live Accounts do not have:
Virtual Accounts are not subject or responsive to Corporate actions such as buyouts, name or symbol changes, stock/option splits and strike price adjustments to name some examples.
![]()
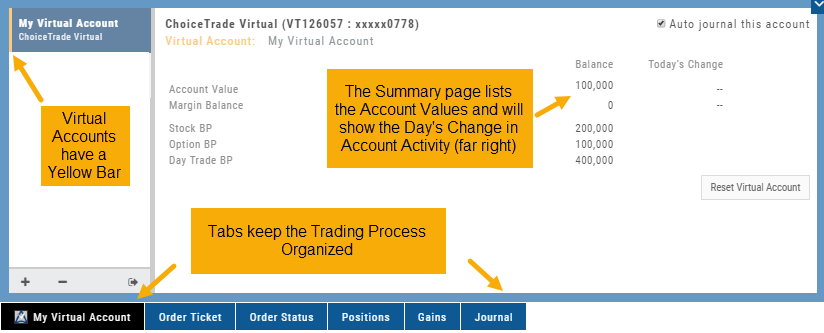
Virtual Accounts are “Auto-Journaled”. This automatically keeps record of all trades for later analysis and reconciling.
These practice accounts are identified by a yellow bar on the left side of the account window.
Virtual Accounts are powered by Choice Trade to provide the real trading experience.
Color Tag Trading Accounts
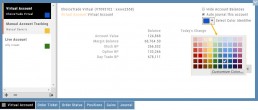
Select a unique color for each trading account on the Account Summary tab. Each trade in that account will display that color on the Journal trade tab entry.
Now it’s easier than ever to identify trades at a a glance.
Order Types - How to Enter
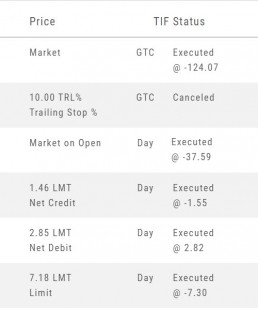
Market Order are Buy or Sell orders to be executed immediately at current the Market Price. Execution of the trade is more important than price. As long as there is a willing buyer or seller, the trade will be executed.
Limit Orders (including Net Debit and Net Credit) allow you to set the Maximum Price to Buy or Minimum Price to Sell a security . Because these orders have ‘limits’ they may not be executed. When they are, they will be executed at the Limit Price – or better.
Low Volume, a slow or very fast market may mean your Limit Price may not be reached and thus, your order not executed.
Stop & Stop Limit Orders
These are protective orders, to be placed on a current position.
A Stop Order becomes a Market Order when the Stop Price is reached. This does not mean you will get the Stop Price when the Order executes. You are willing to Buy/Sell at any price once your Price is reached to have the Order execute.
A Stop Limit Order generally offers more protection: Once the Stop Price is reached, the order converts to a Limit Order to execute once that price – or better- is reached. Thus, there are two values to enter on the Order Ticket for Stop Limit Orders.
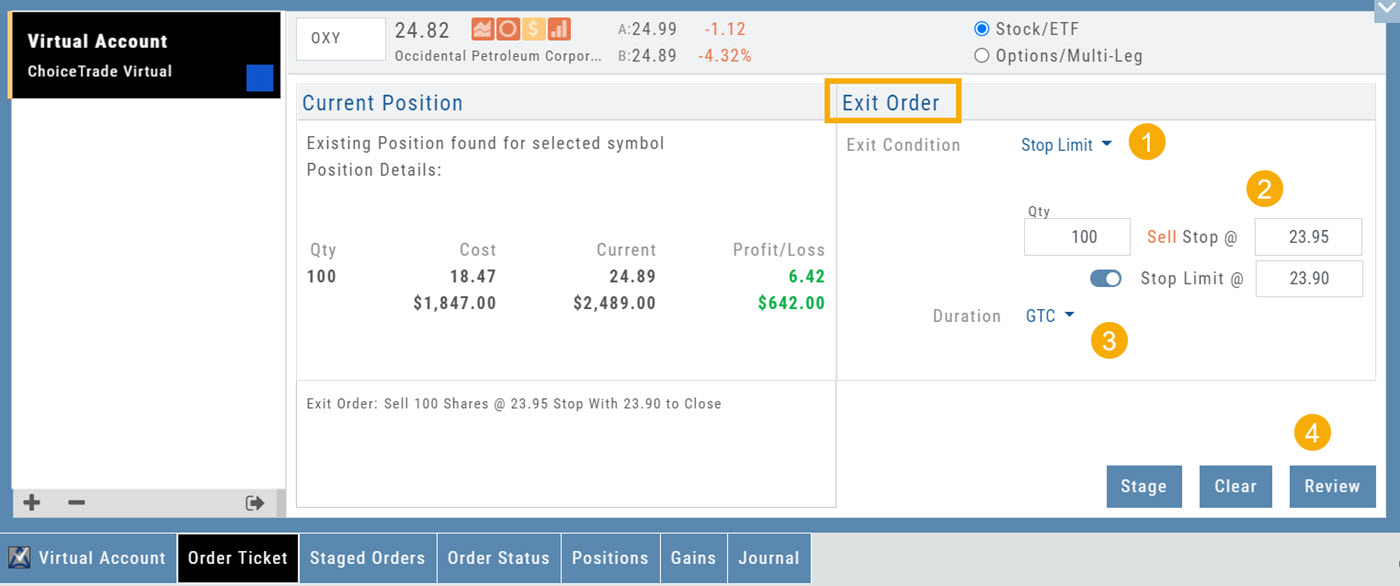
How to enter a Stop Order/Stop Limit Order:
On the Positions tab, click “Close” for the Stock/ETF entry you want to add a Stop/Stop Limit Order to. You’ll be navigated to the Order Ticket tab to continue.
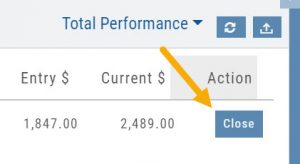
On the right side of the Order Ticket (Exit Order):
1. Change Exit Condition from default “Limit” to “Stop” or “Stop Limit“
2. Enter Stop Price. For Stop Limit Orders, the Stop Price will be the higher of the two values.
Enter Limit Price, if applicable.
3. Change Duration from Day (default) to GTC (which may vary by brokerage)
4. Review & Submit
Notes: As long as it’s not a Day order, the Stop/Stop Limit order will remain Live until you cancel the order or it executes*. (Some brokerages have expiration dates on such orders)
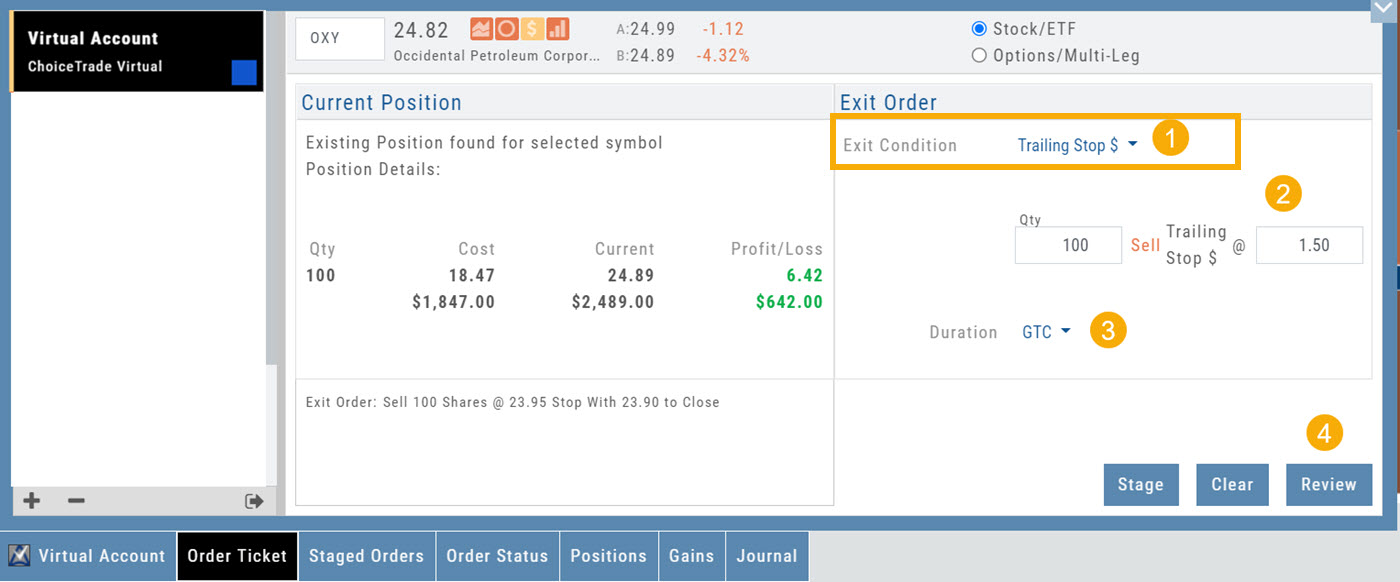
Trailing % and Trailing $
As the names suggest, these orders follow trades upward by a set $ or %. They are placed on a current position. Click “Close” from the Positions Tab, then follow the steps below:
1. Change Exit Condition to “Trailing % (or $)“
2. Enter price or percentage to exit trade
3. Select Duration (Day/GTC)
4. Review, then Submit
This will be a Live Order until it Executes, Expires or is Cancelled.
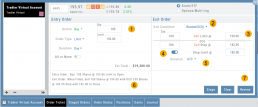
Bracket Order – One Cancels the Other (OCO)
- Opening Order OR the existing Position to Close
- Select “Bracket (OCO)”
- If the trade is favorable, the Limit Price will trigger to close and secure profit.
- If the trade is unfavorable, this Stop (or Stop Limit) Order can limit your loss
- Duration: “Day” or “Good Til Canceled”
- Summary of the Bracket-OCO Order
- Review for accuracy, then Submit on the next screen
Positions Tab
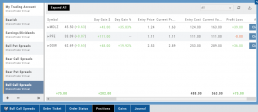
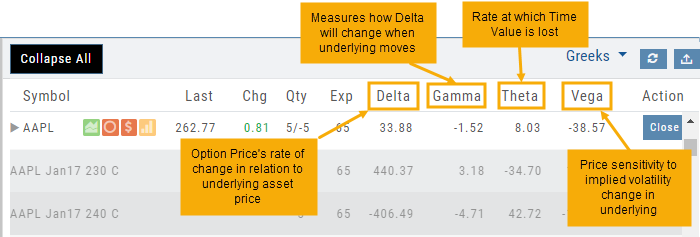
The Positions Tab offers 4 table views of your current trades. You can access these by clicking on the drop-down box in the upper right of the screen. “All” combines the 4 views. 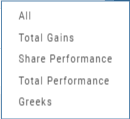
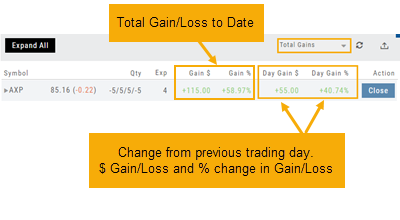
Total Gains
This table view displays the Overall $ and % Gain/Loss and the Daily $ and % Gain/Loss based on the previous trading day’s results.
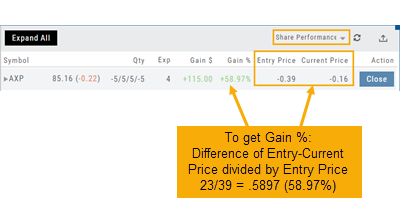
Share Performance
This table breaks down Total Gains by showing Entry Cost compared to Current Value per Share.
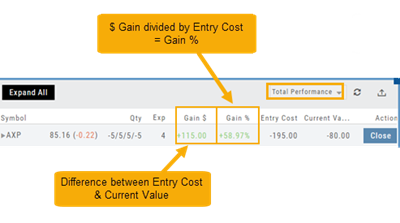
Total Performance
Similar to Share Performance, but shows Total Entry Cost and Total Current Value.
Greeks
Access Trading Account Information
No need to login to Brokerage Account site for normal day-to-day activity.
Each account includes a Summary page showing the Account Balance, Margin Balance, Stock, Option & Day Trading Buying Power and tracks the current trading day’s activity.
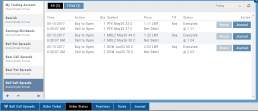
Besides the Order Ticket, the Order Status, Current Positions & Transaction History are all available. You can view previous order history in the Order Status tab by clicking on the drop-down menu on the upper-right corner of that screen.
You can access any account and switch accounts with a single click. You can even change the account from the order ticket.
The newest feature, Journal provides the means of organizing, noting, analyzing & reconciling trades.


