Order Staging (Premium Desktop Feature)
This feature allows the user to save Potential Trades for further consideration to decide the best ones to submit.
Staging is also useful when the Market is closed – to be reviewed when the Market is open to determine if it’s still a high-probability trade.
With one click, you can send to the Research Tab, Move to an Order Ticket or Delete and move on to the next staged order.
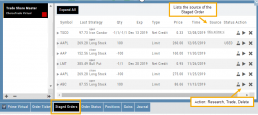
When Trade Sharing is enabled, Trades made in accounts you are following will be displayed in your Order Staging Tab. The Source will indicate the Account Name. Status of “Used” will display for those trades you submit on one of your accounts.
Expired Staged Orders will automatically be removed.
Following a Shared Account (Premium Desktop Feature)
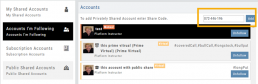
Under Portfolio>Sharing, click on “Accounts I’m Following” on the left-hand panel.
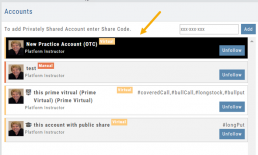
The center panel, above the Account List has a section to enter the code for the Account to be shared on your platform. Enter the code, then click “Add“
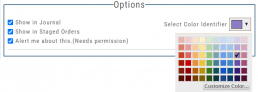
On the bottom, right panel box under “Options“, make sure to check boxes:
Show in Journal
Show in Staged Orders
Alert me about this (Needs permission)
Your device’s settings need to be permissioned for Alerts.
Finally, for easy trade identification, select a color identifier from the dropdown box in the right corner of the Options box.
Set Up Trade & Journal Sharing (Premium Desktop Feature)
Trade and Journal Sharing
Step 1:
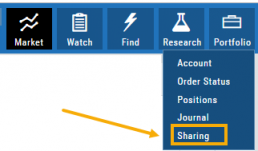
Select “Sharing” under the Portfolio Tab to to access these features of sharing trade ideas with peers or trading groups or have access to an Instructor’s Trades or Journal History.
Trade Sharing allows for potential trades to display in “Order Staging” listing the Source of the Order.
Journal Sharing can be used to follow a Trading Group, Instructors, Peer, Public Accounts as well as Newsletters/Trading Room applications.
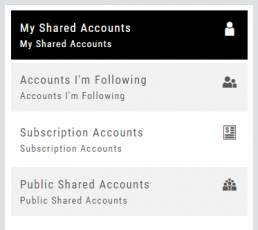
Step 2: On the left-hand panel, click on “My Shared Accounts”
Shared Accounts are grouped into 4 categories:
- My Shared Accounts – Elect to share Order Staging and/or Journal Sharing
- Accounts I’m Following – Other peers, trading partners, instructors
- Subscription Accounts – Newsletter or Trading Group applications
- Public Shared Accounts – allows access to a Public Directory with performance metrics
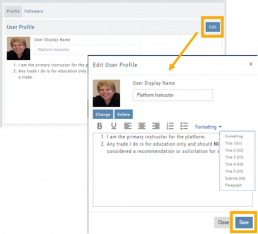
Step 3: Set up your User Profile
Click “Edit“
Add a User Display Name
Provide a Bio and/or Information about the account. This is what others will see.
The Formatting option allows you to customize the Bio/Information box.
Click “Save“
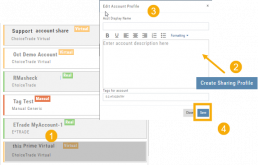
Step 4: Set Up Account Profile
1. In the middle panel, click on the Account to be shared
2. On the bottom right panel of the page, click on “Create Sharing Profile“
3. On the pop-up window, add an Account Display Name and Account Description.
Note: Both are required.
You are also able to add #tags to this Account Profile.
4. Click “Save“
Available buttons allow you to Generate New Code and Disable Code.
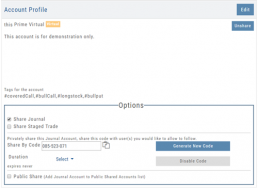
Account Options
Once Shared, you can “Unshare” account by clicking on button located in the upper right of this box.
Share Journal is checked by default.
Check box for Share Staged Trades if you wish to provide that on the selected account.
A code is automatically generated to Privately Share/Peer-to-peer share
Duration drop-down menu allows you to set how long the code is valid:
Single use only
Hour
Day
Week
Until Disabled
Intraday Trade Finder Scan Updates (Premium Desktop Feature)
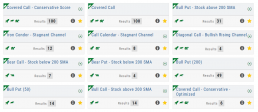
Trade Finder Scans are updated every 30 minutes during Market Hours on the Premium Platform. That’s 12 more times than the Standard Platform version, which updates once after the Market opens.
Trade Finder Scans are easily identified with a Rocket Icon in the upper left corner of the Scan box.
Export Reports (Desktop)
Clicking on ![]() located on the upper left corner of the Positions and Gains tabs allows you to export that information as a .csv file.
located on the upper left corner of the Positions and Gains tabs allows you to export that information as a .csv file.
The Journal give you the ability to export reports in a PDF file on your desktop platform. But that’s just the beginning.
You can export from the Transaction or Reconciliation view filtered by Account, Symbol, Tags, Notes and/or Date Range.
Life of Trade View also allows you to filter by Order Status in addition to the above criteria for even more focused report. Only want to print Closed Trades? Want to see how many trades are Unmatched? Select those filters.
The top of your Journal report displays the Tag Summary based upon the account(s) and filtering criteria selected.
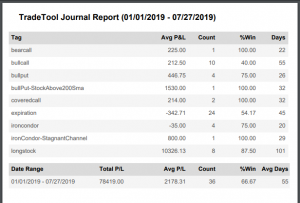
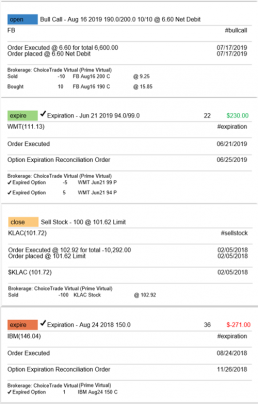
The trade detail report displays the status, Open, Close, Expire with a color code of the trade: Blue=Open, Green=Profit, Red=Loss, Yellow=Unmatched.
Link Trades in Journal
Trades can easily be linked in the Journal. This is helpful to keep related trades grouped together for easier tracking and analysis.
Some common applications include:
- Covered Calls – keeping stock and selling Calls with different Expirations
- Adjustment/Repair Trades
- Other previously Unmatched trades
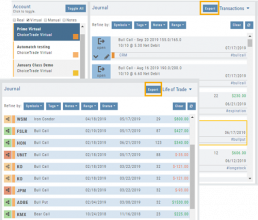
This feature is best used in the Life of Trade View in the Journal.
The following steps will allow you to Link Trades: 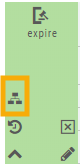
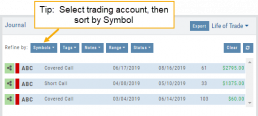
1. After selecting your account and sorting by symbol, expand one of the trade tabs you want to link to another trade group or set.
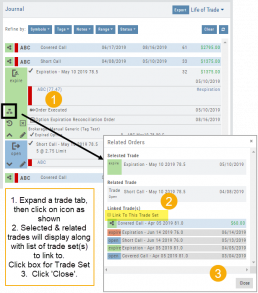
Click the ‘Link Icon‘
2. A pop-up window will list the Selected (Expanded) Trade, any related trade and Available Trade Sets for that symbol in that account.
Note: You can link trade sets both prior to and following your current, selected trade.
Example: You want to link a May 2019 expired Call to April 2019 and June 2019 Covered Call trade set.
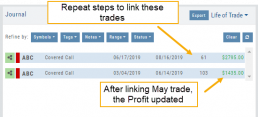
3. Click “Link To This Trade Set” for trade set(s) to link selected trade to, then click “Close“.
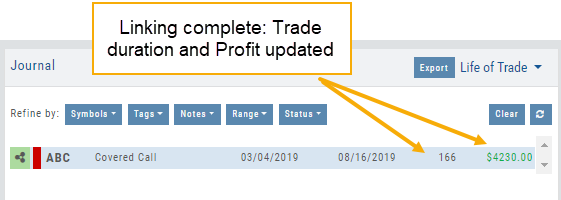
In this example, we linked an Expired May 10 2019 short call to an April and June Covered Call trade set.
After linking the trade, notice the total Profit (Loss) Amount updated, but the trade duration did not.
This is because the May Call falls in between the original April trade entry and the June expiration.
If you have more trade sets to link, repeat the previous steps as outlined.
Final note: If you link a trade in error, simply expand the same trade tab and ‘uncheck’ the Link This Trade Set box.
Life Of Trade Icon/Color Codes
The Life of Trade Icon and Tab/Trade entry color show help you identify the status of your trades.
Icon Display and Color Coding
Note: Orders are automatically updated when you login to your trading account, whether Live, Virtual or Manual
 Blue – Hollow Dots – No Connection
Active Order or Open Original Trade
 Yellow – Hollow Dots – Open Connection
The Original Trade has been adjusted, but is still an Active Trade
 Yellow – Solid Dots – Closed Connection
The Trade and any Adjustments have been closed, but one or more entries need to be
Matched or Reconciled
![]()
Green – Solid Dots – Closed Connection
Closed trade – which includes any adjustments – resulting in a Profit
![]()
Red – Solid Dots – Closed Connection
Closed Trade – which includes any adjustments – resulting in a Loss
Trade Entry Lines
Note: Depending on the Theme used, the following colors will vary. The bar color denotes whether the trade needs action – such as Reconciliation or Matching to another trade.
Blue Line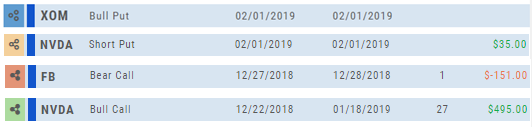
No action needed on these entries. The colored left tab shows the status of each trade:
Blue: (Open Trade, hollow dots, no connection), Yellow: (Adjusted, hollow dots, partial connection), Red: Loss (Closed, solid dots, connected), Green: Profit (Closed, solid dots, connected)
Yellow Line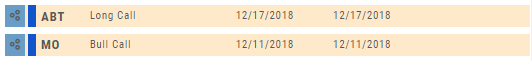
Action is needed on these trade entries. The Trade may have gone through Expiration and needs to be Reconciled. By clicking on the Trade Line, the Trade Tab will display:
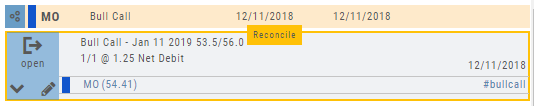
Once the action is completed, the entry will update on all Journal tables including the Tags, P/L Graph & Insight tabs.
It is important to reconcile expired trades to properly display profit and provide updated analytical information on your trading success.
Color Codes of The Trade Journal
The Tabs on the Journal are Color Coded for Easy Understanding of the Trade
Primary Tab Color Coding (see below for expiration tab coding)
Note: Orders are automatically updated when you check order status. Just make sure to select the time frame to cover the trades that need updating
 Light Blue
Active Live Order
This indicates that you have a current live order
 Dark Blue
Trade – Open
This indicates the opening transaction of a trade
 Gray
Gray
Expired or Canceled Order
This can be from a order that you canceled, or a day order that did not get filled
 Green
Green
Closed Trade – Profit
This indicates a trade that you closed for a profit
 Red
Red
Closed Trade – Loss
This indicated a trade that you closed for a loss
 Yellow
Closed Trade – Unmatched – Requires action to match to related
trade. Expand tab to see detail of trade.
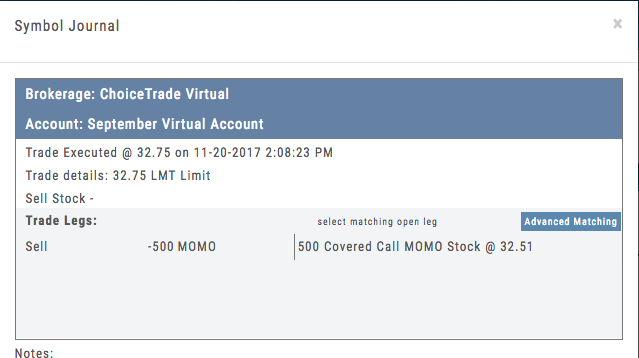 Unmatched Trades can happen if there are multiple trades and an entry trade needs to be identified or because a multi-leg trade was split on exit, or change of stock position when an option expired (exercise/assignment)
This is easily matched by clicking the edit icon (pencil) and selected which open order to match to. In some cases there may only be one, and it is simply a verification.
Expiration Tab/Tagging Colors
 Red or Green with No Color Tagging
This indicated the option trade expired Out of the Money (OTM)
There were no options exercised or assigned through expiration
 Red or Green with Dark Green Color Tag
This indicated that there were ITM options exercised/assigned
However, there was no change is stock ownership. Example: Bull Call where both legs were exercised/assigned.
 Red or Green with Yellow Color Tag
This indicates a change in stock ownership through exercise/assignment
This will happen with single leg options trade or where one leg of a spread was ITM at expiration
It is important to reconcile expired traded to properly display profit. If there are unreconciled expired options, the reconciliation window will automatically display when you go to the options tab.
Portfolio
Manage Your Portfolio from the Platform
With Brokerage Integration you can trade directly from the platform with select brokerage firms. Currently TD Ameritrade and Choice Trade are available. With more on the way.

Strategy Template
A Strategy Template provides a shortcut to quickly create an option strategy, virtually eliminating structure errors. Once selected, you can modify the structure within the template using the tools on above the option tables: Moving Strikes up/down, rolling Time out/in, widening or narrowing Strikes.
![]()
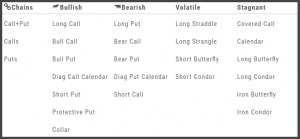
Some strategies can be changed from all Calls to all Puts (and vice-versa).
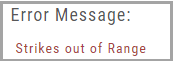
Note: The templates will not allow you to exceed certain parameters, as attempting to do so would result in an invalid strategy. This is a built-in safety net and you would receive a notice similar to: