Evaluate Existing Positions
Positions will automatically show on the options chain for the active brokerage account.
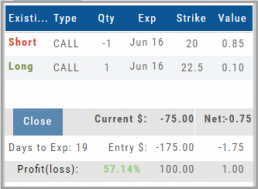
You can also access directly from Broker Positions. Select “Analyze” from the Action menu. 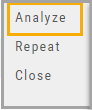
This will display the current values as well as entry cost and current P/L.
Here you can also close the position or evaluate adjustments on the trade.
Adding an Account
Accessing a live account is easy. Currently Choice Trade, Tradier, Schwab, E*TRADE are offered through this platform. More brokerages will be added.
To add an Existing Brokerage Account or add a Virtual or Manual Account:
1. Clicking on the “+” icon will display the screen below
2. Select your Brokerage, Virtual or Manual Account from the drop-down
3. Read & Accept Terms and Conditions
4. Click “Continue”

Live Accounts will prompt you to enter your credentials on the next screen.
Virtual** and Manual Accounts will automatically activate.
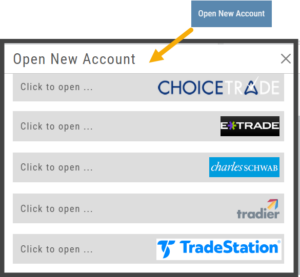 To add a New Live Account, click on the “Open New Account” box on upper right of the above screen.
Select the account you want to add by clicking the selected brokerage.
Click the “Done” button.
You’ll be directed to the brokerage website to guide you through the process of completing an application.
**TradeStation requires a completed account application to create a Virtual Account.
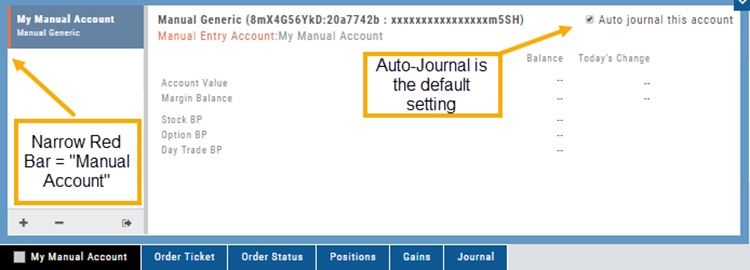
Manual Account Overview
A Manual Account is versatile resource tool which can enhance your trading effectiveness. You can also use this to track trades from an outside brokerage account.
Use the Manual Account for educational purposes.
- It offers flexibility and control, while providing the Analytics and Journal to help you reinforce the “Learning to Earning” process. This allows you to focus on learning the strategies.
- Place trades any time of day or night – all get immediately executed at the price entered. No need for the market to be open.
- No Buying Power limits – no expensive spread margin requirements to adhere to, no limit on how much you can buy/sell
- Place trades in the past.
- Enter trades from Backtest Mode
Use to tracking external accounts
- Can be used to track trades placed at brokers not integrated into the platform
- You can enter the date and fill prices of your actual trades
- This enables portfolio management along with your other accounts
- You can use full Journal function for tracking your progress
Manual Accounts are identified by a narrow Red Bar and are, by default, Auto-Journaled.
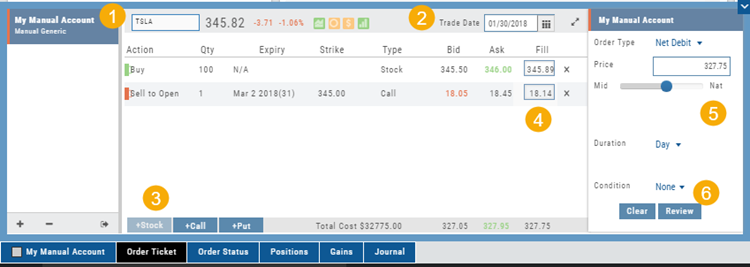
Entering trades in a Manual Account takes only a few steps and is similar to a regular trade.
You can also bring up the ticket from any trade point. Simply start a trade and select the manual account just like you would select any other account.
(Bold indicates unique to Manual ticket):
1. Enter the Stock Symbol, or name of Company (Smart search will display potential matches)
2. If this is a past trade, use the calendar/date picker to select date
3. Click “Stock”, “Call” or “Put” to build trade, change quantity, Expiry and Strike (if applicable)
4. Bid/Ask will automatically populate if a specific price is not entered
5. Complete Order Type, Duration and Condition
6. Click “Review” to confirm information is correct, then ‘Submit” on next screen.
The order will appear in Order Status as “Executed” and operate the same way as other accounts.
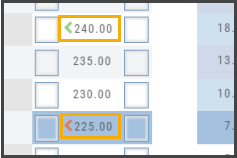
Position Indication on the Chain
When evaluating an existing position on the options chain, the positions held are indicated with arrows on the chain. The arrows point to the quantity entry box of the held position.
Green arrows ![]() indicate Long or Buy positions.
indicate Long or Buy positions.
Red arrows ![]() indicate Short or Sell positions.
indicate Short or Sell positions.
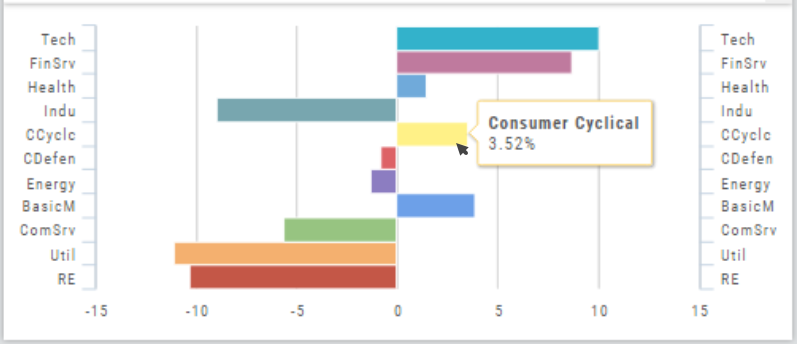
Industry Performance Bar Chart
The Bar Chart is located on the Market Tab and updates dynamically with selected Heat Map Index and Time Frame. This provides an additional view of the overall Market by Industry. Below is a 3 month Heat Map/Bar Chart view of the S&P 500. The bottom Bar Chart shows a 6 month view.
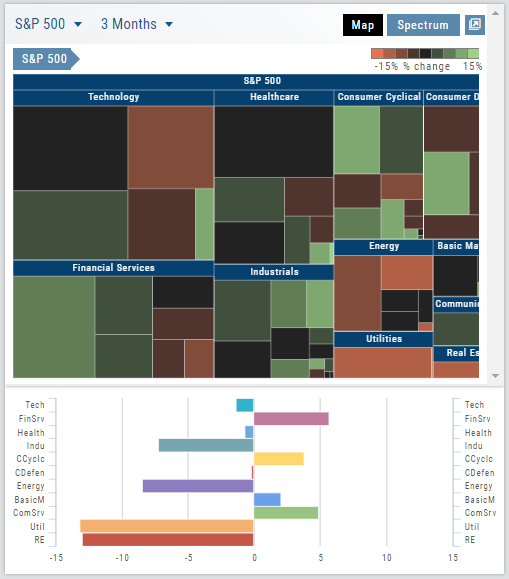
Each Industry is represented by a unique color and are listed by Market Cap – largest on top to the smallest at the bottom. Hover your cursor over each bar for the Industry name and % change of the selected time period to appear.
The center of the Chart is Neutral and will appear blank just prior to the Market’s Opening Bell. Bars extending right of center represents Gains, left of center represents a Loss for the time period selected on the Heat Map.
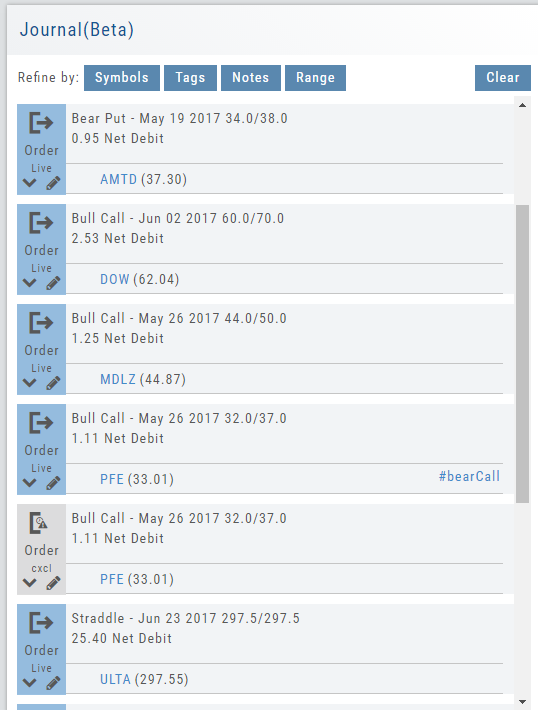
Journal Navigation
![]()
It’s easy to look up trades. Choose from Stock symbols, tags used (ex: #bullCall, #longStraddle), Notes containing certain words or phrases, or date ranges from 1 Day to 1 Year.
On the individual Trade tabs, click the ![]() icon to expand the trade detail. To edit/add tags, notes, to the trade entry, click
icon to expand the trade detail. To edit/add tags, notes, to the trade entry, click ![]() then ‘save’ when completed.
then ‘save’ when completed.
Once the Trade Tab is expanding , you have additional options: The “Replay” icon, ![]() , sends a trade from the Journal to Backtest Analysis. You can delete a Journal Entry by clicking on
, sends a trade from the Journal to Backtest Analysis. You can delete a Journal Entry by clicking on ![]() .
.
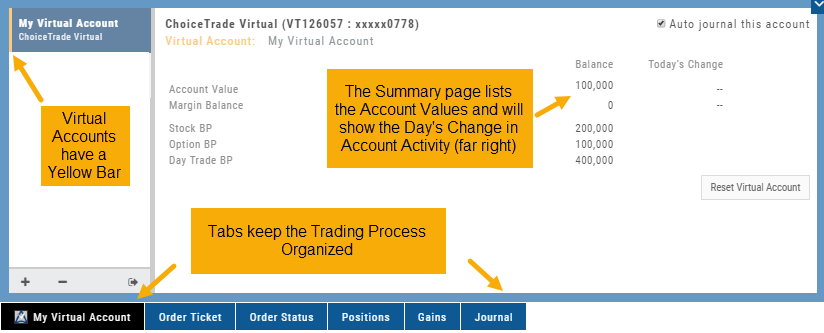
Virtual Account Overview
Virtual Trading gives you the real trading experience without risking any money. It is a valuable “next step” learning tool – designed to mimic the trading experience as closely as possible.
Trades are executed during Market hours – 9:30 a.m. – 4 p.m. Eastern Time, however there is a 15 minute delay after Market open for orders to begin executing.
As with Live Accounts, there are limits on trades if there is not sufficient Buying Power in your Virtual Account. There can be expensive Spread/Margin Requirements to adhere to.
Virtual Accounts do have limitations that Live Accounts do not have:
Virtual Accounts are not subject or responsive to Corporate actions such as buyouts, name or symbol changes, stock/option splits and strike price adjustments to name some examples.
![]()
Virtual Accounts are “Auto-Journaled”. This automatically keeps record of all trades for later analysis and reconciling.
These practice accounts are identified by a yellow bar on the left side of the account window.
Virtual Accounts are powered by Choice Trade to provide the real trading experience.
Color Tag Trading Accounts
Select a unique color for each trading account on the Account Summary tab. Each trade in that account will display that color on the Journal trade tab entry.
Now it’s easier than ever to identify trades at a a glance.
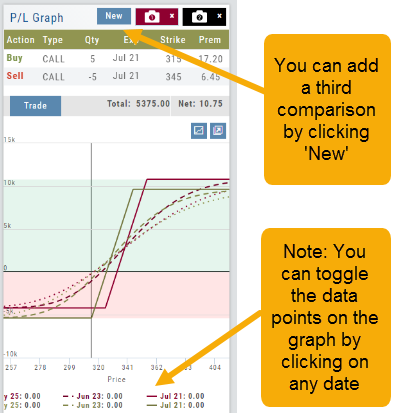
Snapshot: Comparing Positions
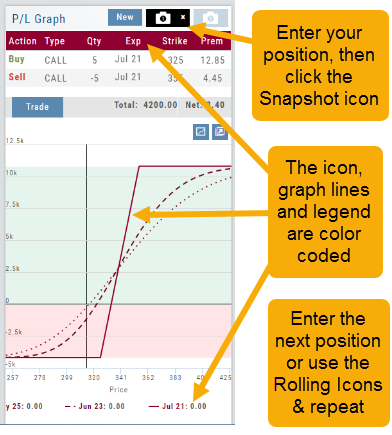
The Snapshot feature gives you the ability to compare up to three scenarios in one view without having to change screens or erase previous setups. You can even submit a trade from this part of the platform!
- From the Calls+Puts chain (as well as “Calls” or “Puts”) enter the initial trade position.
- Next click one of the camera icons:
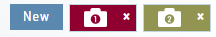
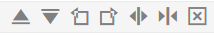
- Repeat the first step using the Rolling Icons to adjust the initial position to a new scenario:
- Click the 2nd camera icon & repeat the above steps for the last trade comparison.
Note: The position lines are color coded to match the Snapshot (or New) icon.
Once you decide on the optimal position, click ‘Trade’ from the P&L Graph and you’ll be taken to the Order Ticket of your brokerage account with the option information auto-filled. 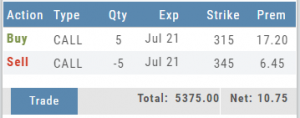
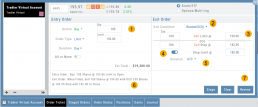
Order Types - How to Enter
Market Order are Buy or Sell orders to be executed immediately at current the Market Price. Execution of the trade is more important than price. As long as there is a willing buyer or seller, the trade will be executed.
Limit Orders (including Net Debit and Net Credit) allow you to set the Maximum Price to Buy or Minimum Price to Sell a security . Because these orders have ‘limits’ they may not be executed. When they are, they will be executed at the Limit Price – or better.
Low Volume, a slow or very fast market may mean your Limit Price may not be reached and thus, your order not executed.
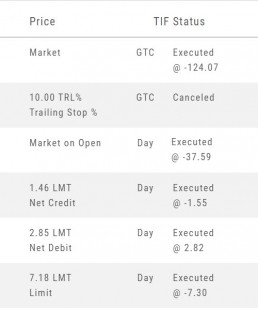
Stop & Stop Limit Orders
These are protective orders, to be placed on a current position.
A Stop Order becomes a Market Order when the Stop Price is reached. This does not mean you will get the Stop Price when the Order executes. You are willing to Buy/Sell at any price once your Price is reached to have the Order execute.
A Stop Limit Order generally offers more protection: Once the Stop Price is reached, the order converts to a Limit Order to execute once that price – or better- is reached. Thus, there are two values to enter on the Order Ticket for Stop Limit Orders.
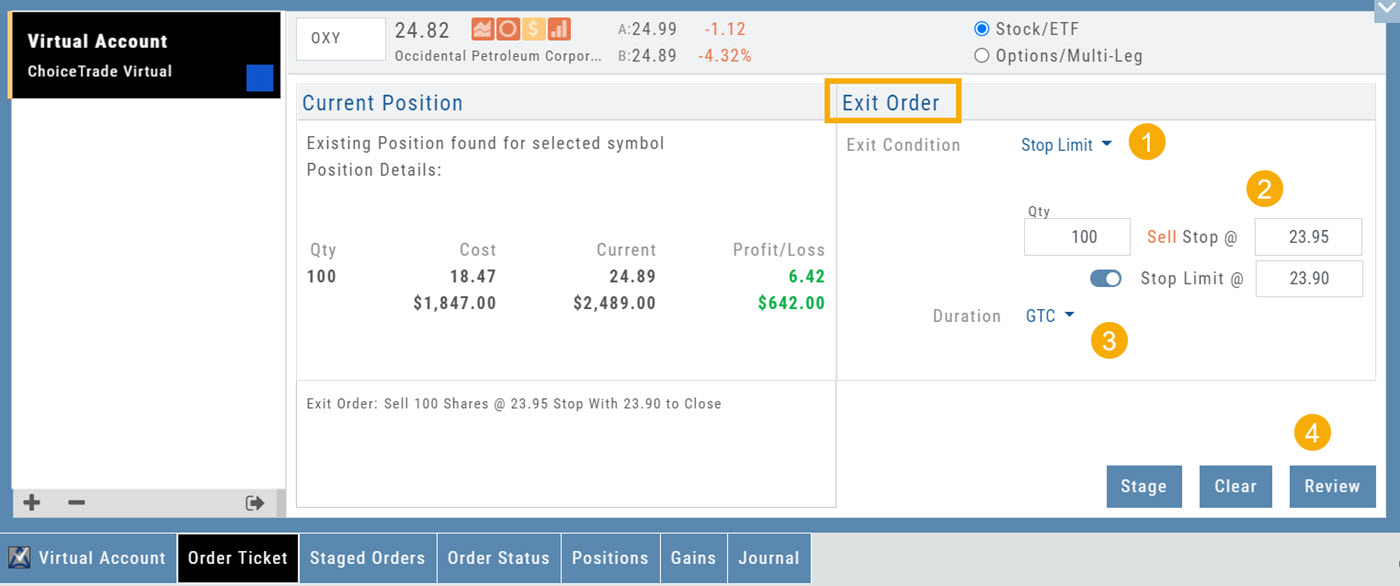
How to enter a Stop Order/Stop Limit Order:
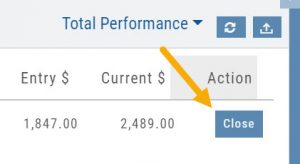
On the Positions tab, click “Close” for the Stock/ETF entry you want to add a Stop/Stop Limit Order to. You’ll be navigated to the Order Ticket tab to continue.
On the right side of the Order Ticket (Exit Order):
1. Change Exit Condition from default “Limit” to “Stop” or “Stop Limit“
2. Enter Stop Price. For Stop Limit Orders, the Stop Price will be the higher of the two values.
Enter Limit Price, if applicable.
3. Change Duration from Day (default) to GTC (which may vary by brokerage)
4. Review & Submit
Notes: As long as it’s not a Day order, the Stop/Stop Limit order will remain Live until you cancel the order or it executes*. (Some brokerages have expiration dates on such orders)
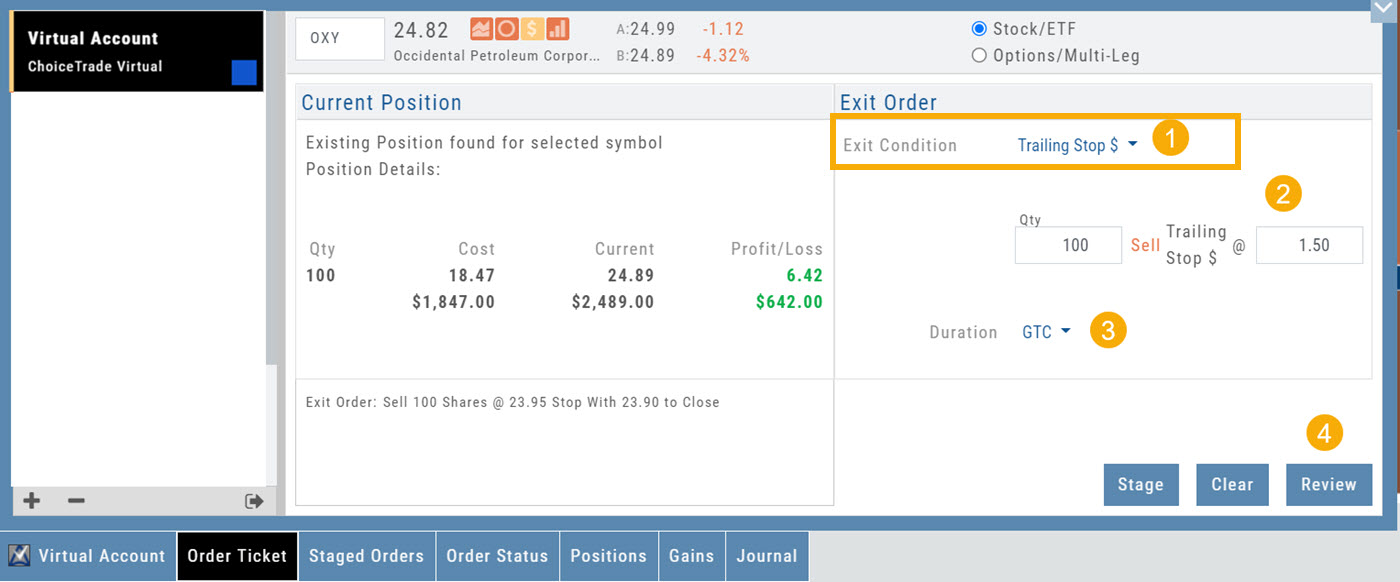
Trailing % and Trailing $
As the names suggest, these orders follow trades upward by a set $ or %. They are placed on a current position. Click “Close” from the Positions Tab, then follow the steps below:
1. Change Exit Condition to “Trailing % (or $)“
2. Enter price or percentage to exit trade
3. Select Duration (Day/GTC)
4. Review, then Submit
This will be a Live Order until it Executes, Expires or is Cancelled.
Bracket Order – One Cancels the Other (OCO)
- Opening Order OR the existing Position to Close
- Select “Bracket (OCO)”
- If the trade is favorable, the Limit Price will trigger to close and secure profit.
- If the trade is unfavorable, this Stop (or Stop Limit) Order can limit your loss
- Duration: “Day” or “Good Til Canceled”
- Summary of the Bracket-OCO Order
- Review for accuracy, then Submit on the next screen